Green Path Platform for Traffic Control Center Operators
Green Path is a product that helps CCOs in Hamburg's Bus Control Centers make quick, informed decisions by providing a prioritized list of traffic incidents and actionable mitigation strategies.
Project Overview
Our product is designed to assist CCOs in Hamburg's Bus Control Centers by simplifying the
decision-making process during traffic disruptions. CCOs are often faced with complex situations
involving multiple traffic incidents and bus operations, requiring quick and effective decisions.
I contributed to the overall design process, including product scoping, creating user flows,
designing wireframes, building prototypes, and conducting usability testing to ensure a seamless
user experience.
Stakeholders
- Hochbahn (Bus and Subway
Control Center in Hamburg) - VHH (Bus Control Center in Hamburg)
Teammates
- Interaction Designer (me)
- Product Manager
- AI Engineer
- Software Engineer
My role
- User Research
- UI Design
- Clickdummy
- User Testing
Timeline
- Sep 2024 - Nov 2024
Problem
Control center operators in Hamburg struggle to manage traffic disruptions efficiently due to fragmented tools, inaccurate real-time data, and limited communication between systems, resulting in delayed decisions and passenger inconvenience.

Solution
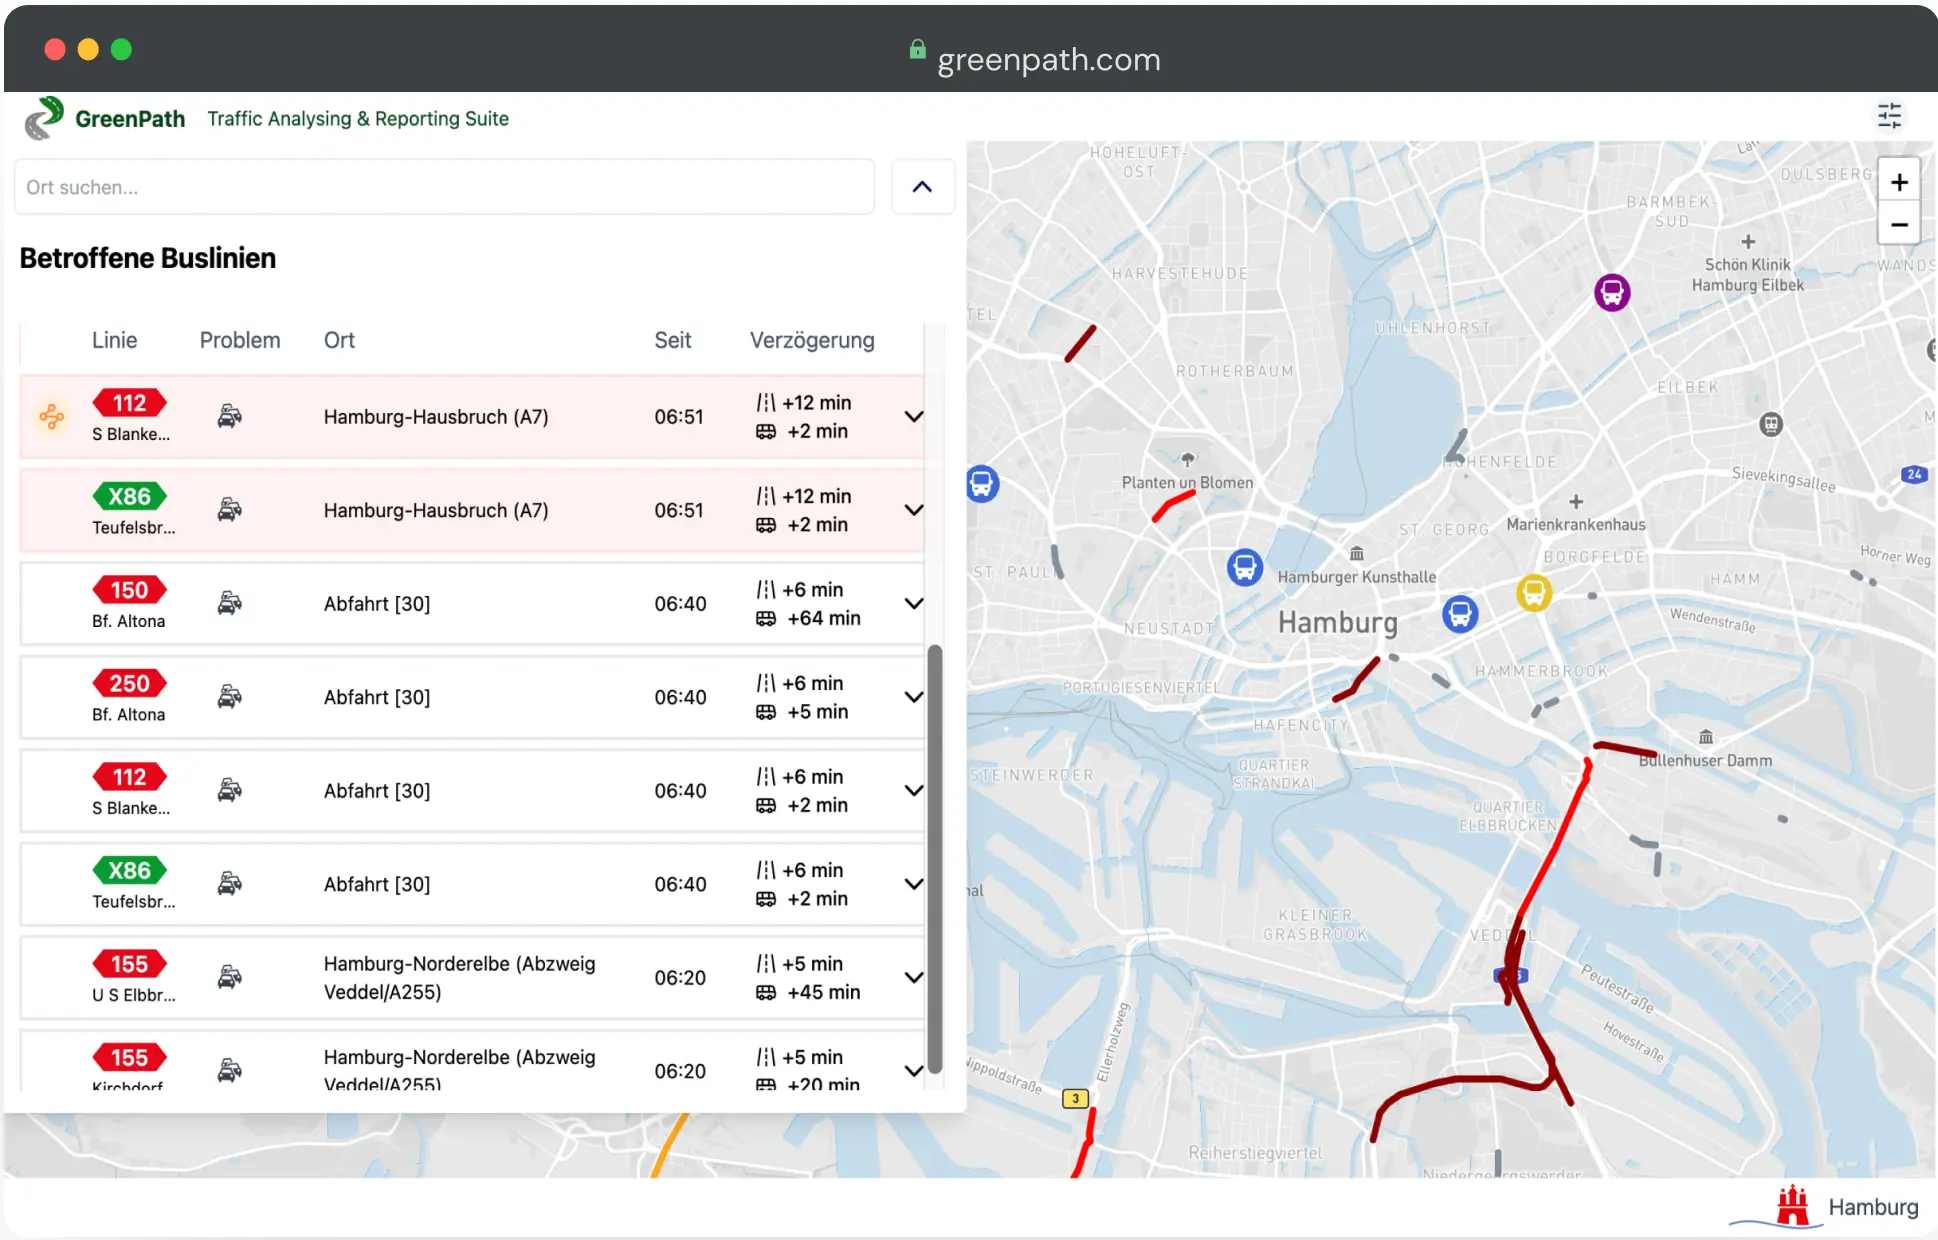
The product empowers CCOs to make quick and informed decisions in traffic situations by reducing the complexity of information and presenting a prioritized list of events, each accompanied by at least one decision recommendation or mitigation strategy. The tool ensures that critical incidents are addressed promptly, minimizing delays and disruptions. By streamlining their workflow and providing actionable insights in real time, it enhances the efficiency of traffic management while allowing operators to focus on high-priority tasks. This ultimately contributes to improved city-wide traffic flow and a better experience for commuters.
Project Timeline
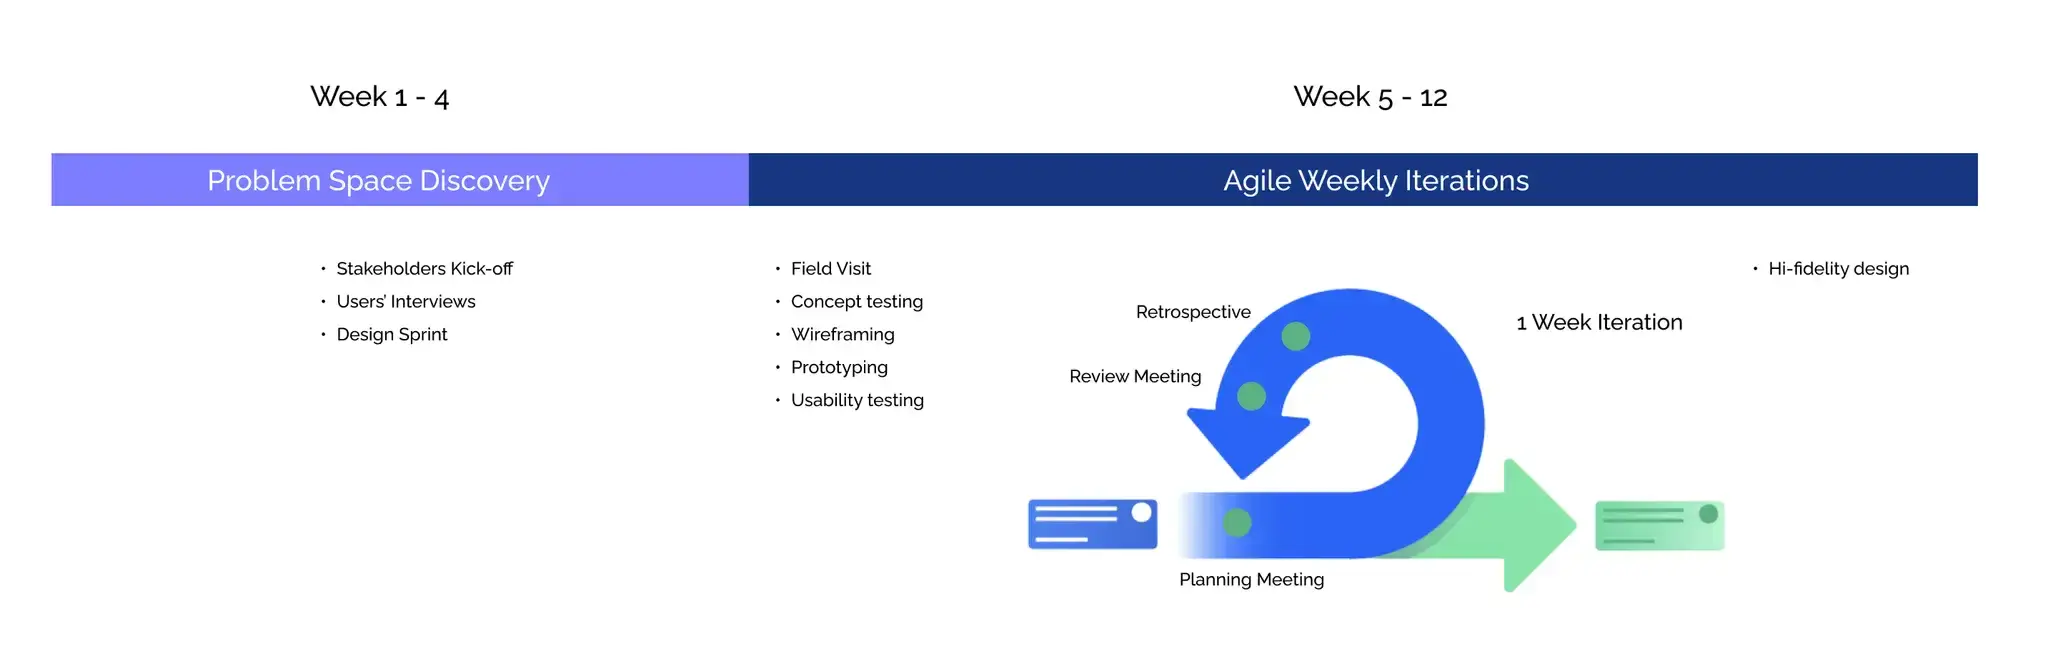
Week 1 - 4: We dedicated the first month to understand thouroughly the problem space and come together as a team to decide what MVP we could deliver in the timeframe of 3 months.
Problem space Discovery (week 1 - 4)
Stakeholder Kick-off
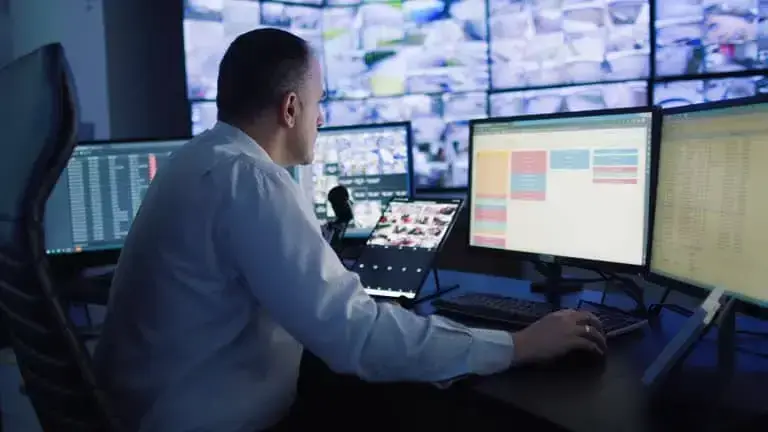
In the first week, we met with our stakeholders, including three officials responsible for overseeing and reporting the performance of traffic and bus control operations. They emphasized the need for a solution that simplifies monitoring and improves the efficiency of handling traffic disruptions. During this session, we gained a high-level understanding of the current monitoring processes, the key challenges faced, and the various stakeholders involved.
Users' Interviews
Following the kick-off meeting, it became clear that the initial problem space was too broad for our limited timeframe. To address this, we conducted interviews with various actors involved in the surveillance process. Our goal was to narrow the scope and identify the key problems that, if solved, would provide the highest impact for our stakeholders while requiring low to medium effort from our side.
User Research
To understand user perspectives on the existing app, I started by thoroughly analyzing its features and functionality. I collaborated closely with the customer care team, who had the most direct interactions with users and valuable insights into recurring pain points. Additionally, I reviewed app store feedback, systematically grouping comments into key themes to identify patterns. We conducted 13 in-depth user interviews, dividing participants into four groups: VHH, Hochbahn operators, and bus drivers. These interviews provided valuable insights into the challenges users faced when managing traffic and bus operations. Key pain points included:
- Managing multiple platforms across different screens is frustrating and confusing
- Real-time information is often inaccurate and not prioritized.
- Missing or incomplete information hampers effective decision-making.
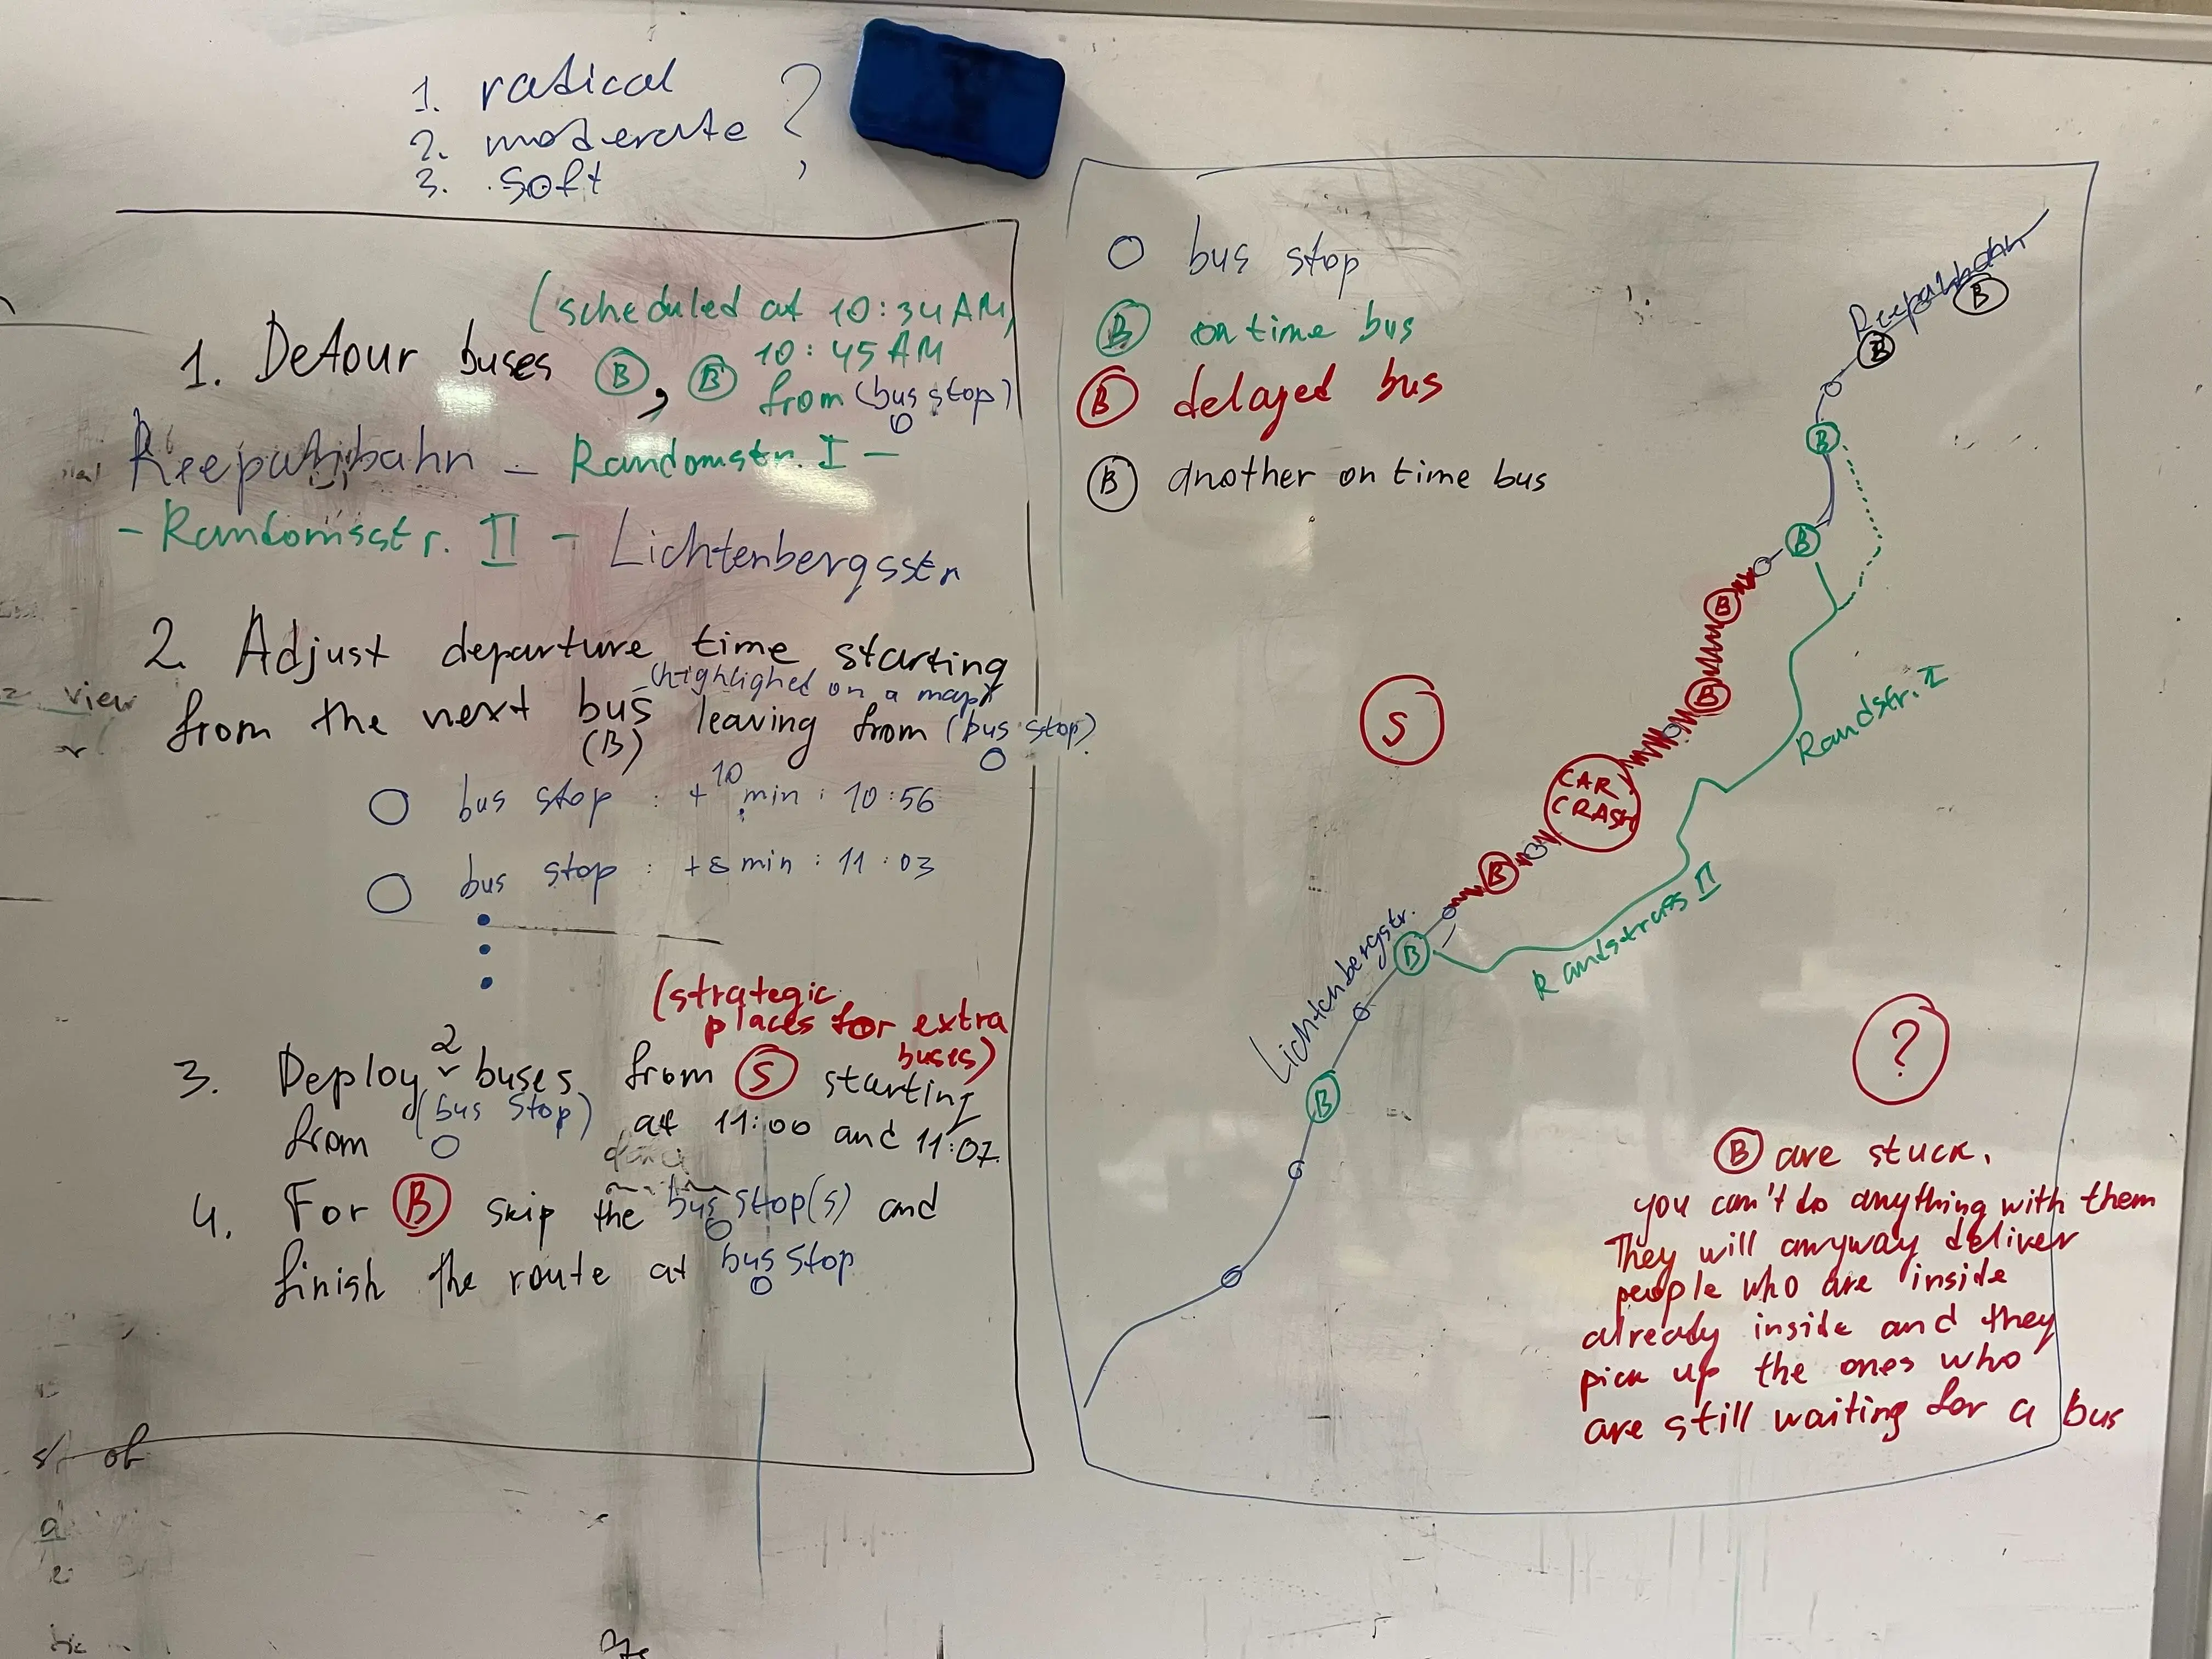
- Difficulties in rerouting buses and coordinating responses efficiently.
- Limited tools for assessing routes and road conditions.
VHH ( Bus Control Center )

Anatoly

Mart

Griff

Huey

Wolfy

Marcia
Hochbahn ( Bus and Subway Control Center )

Kellyann

Stafford

Adriaens

Bobina
Bus drivers

Ketia

Quinn

Glynn
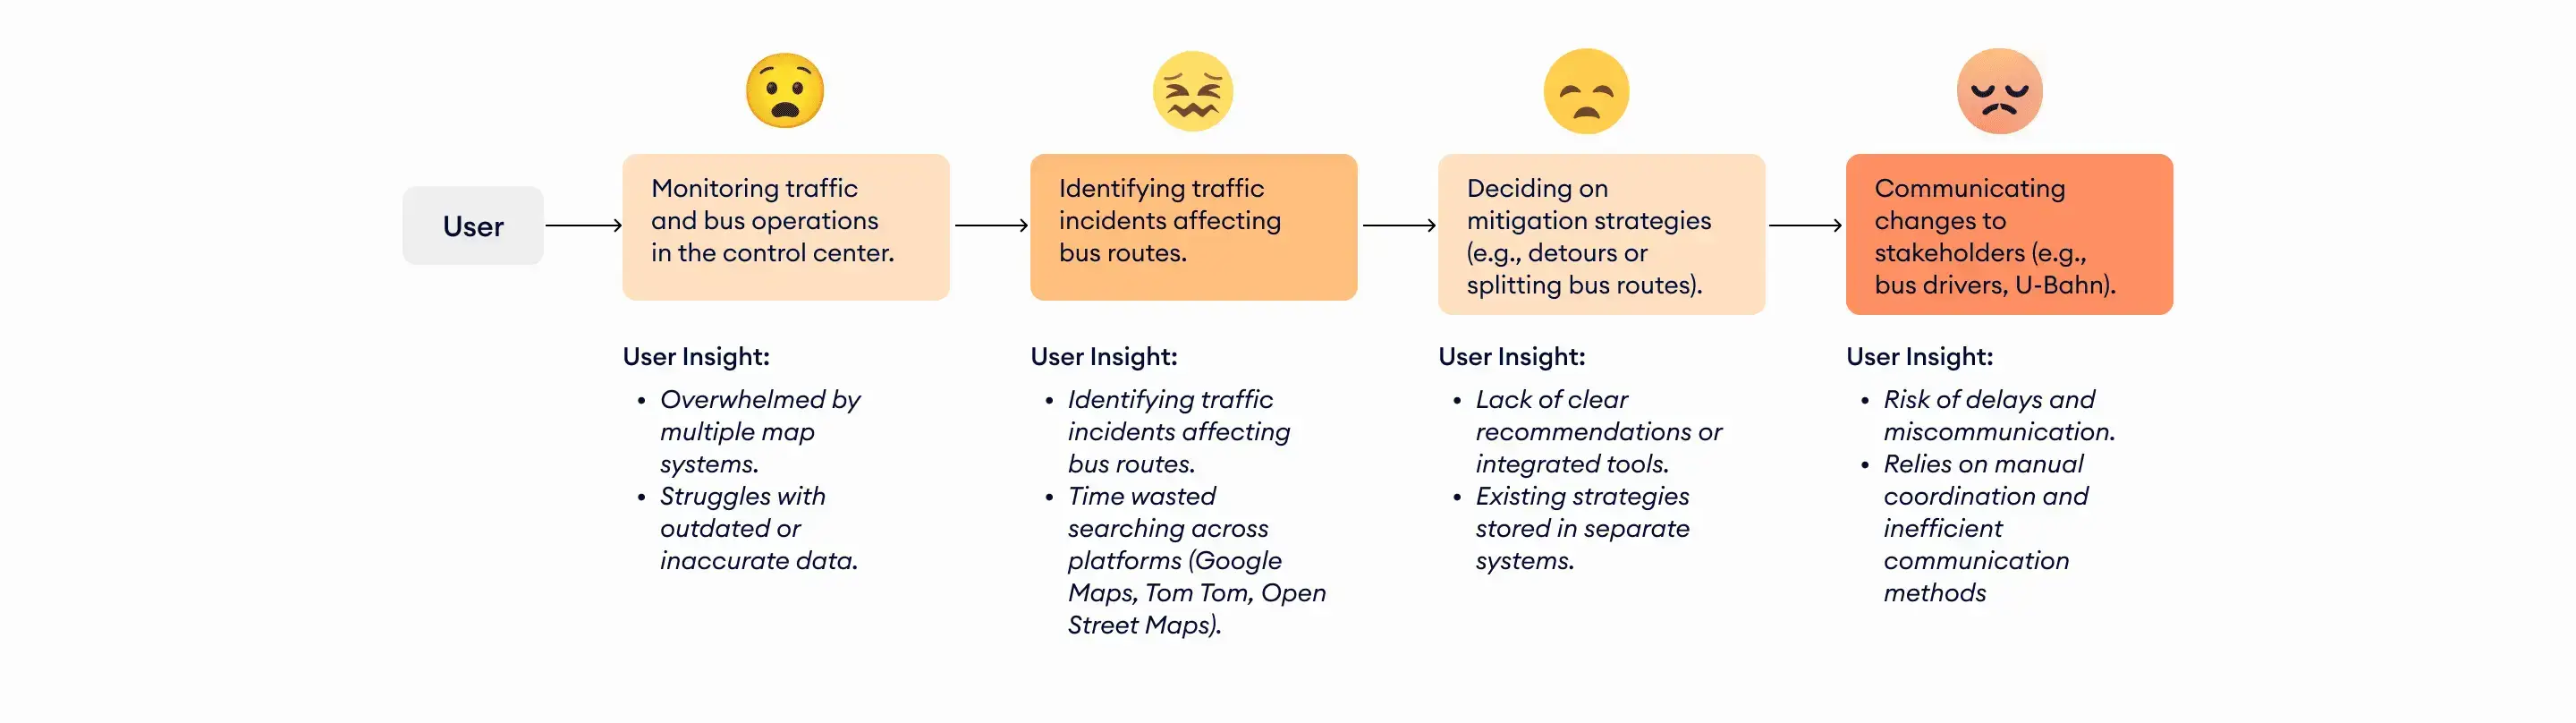
User journey
We identified a clear pattern in how Control Center Operators (CCOs) navigate traffic disruptions and bus operations. Their most frustrating experiences occur when trying to manage incidents due to outdated systems, lack of integration, and the complexity of real-time decision-making.
Weekly iterations and Low fidelity prototype (week 5-12)
I proceeded with designing low fidelity prototypes of the product and continued user testing during sprints, while keeping the story map updated together with the product manager. I informed the team about design changes and shared insights from the tests in dailies.
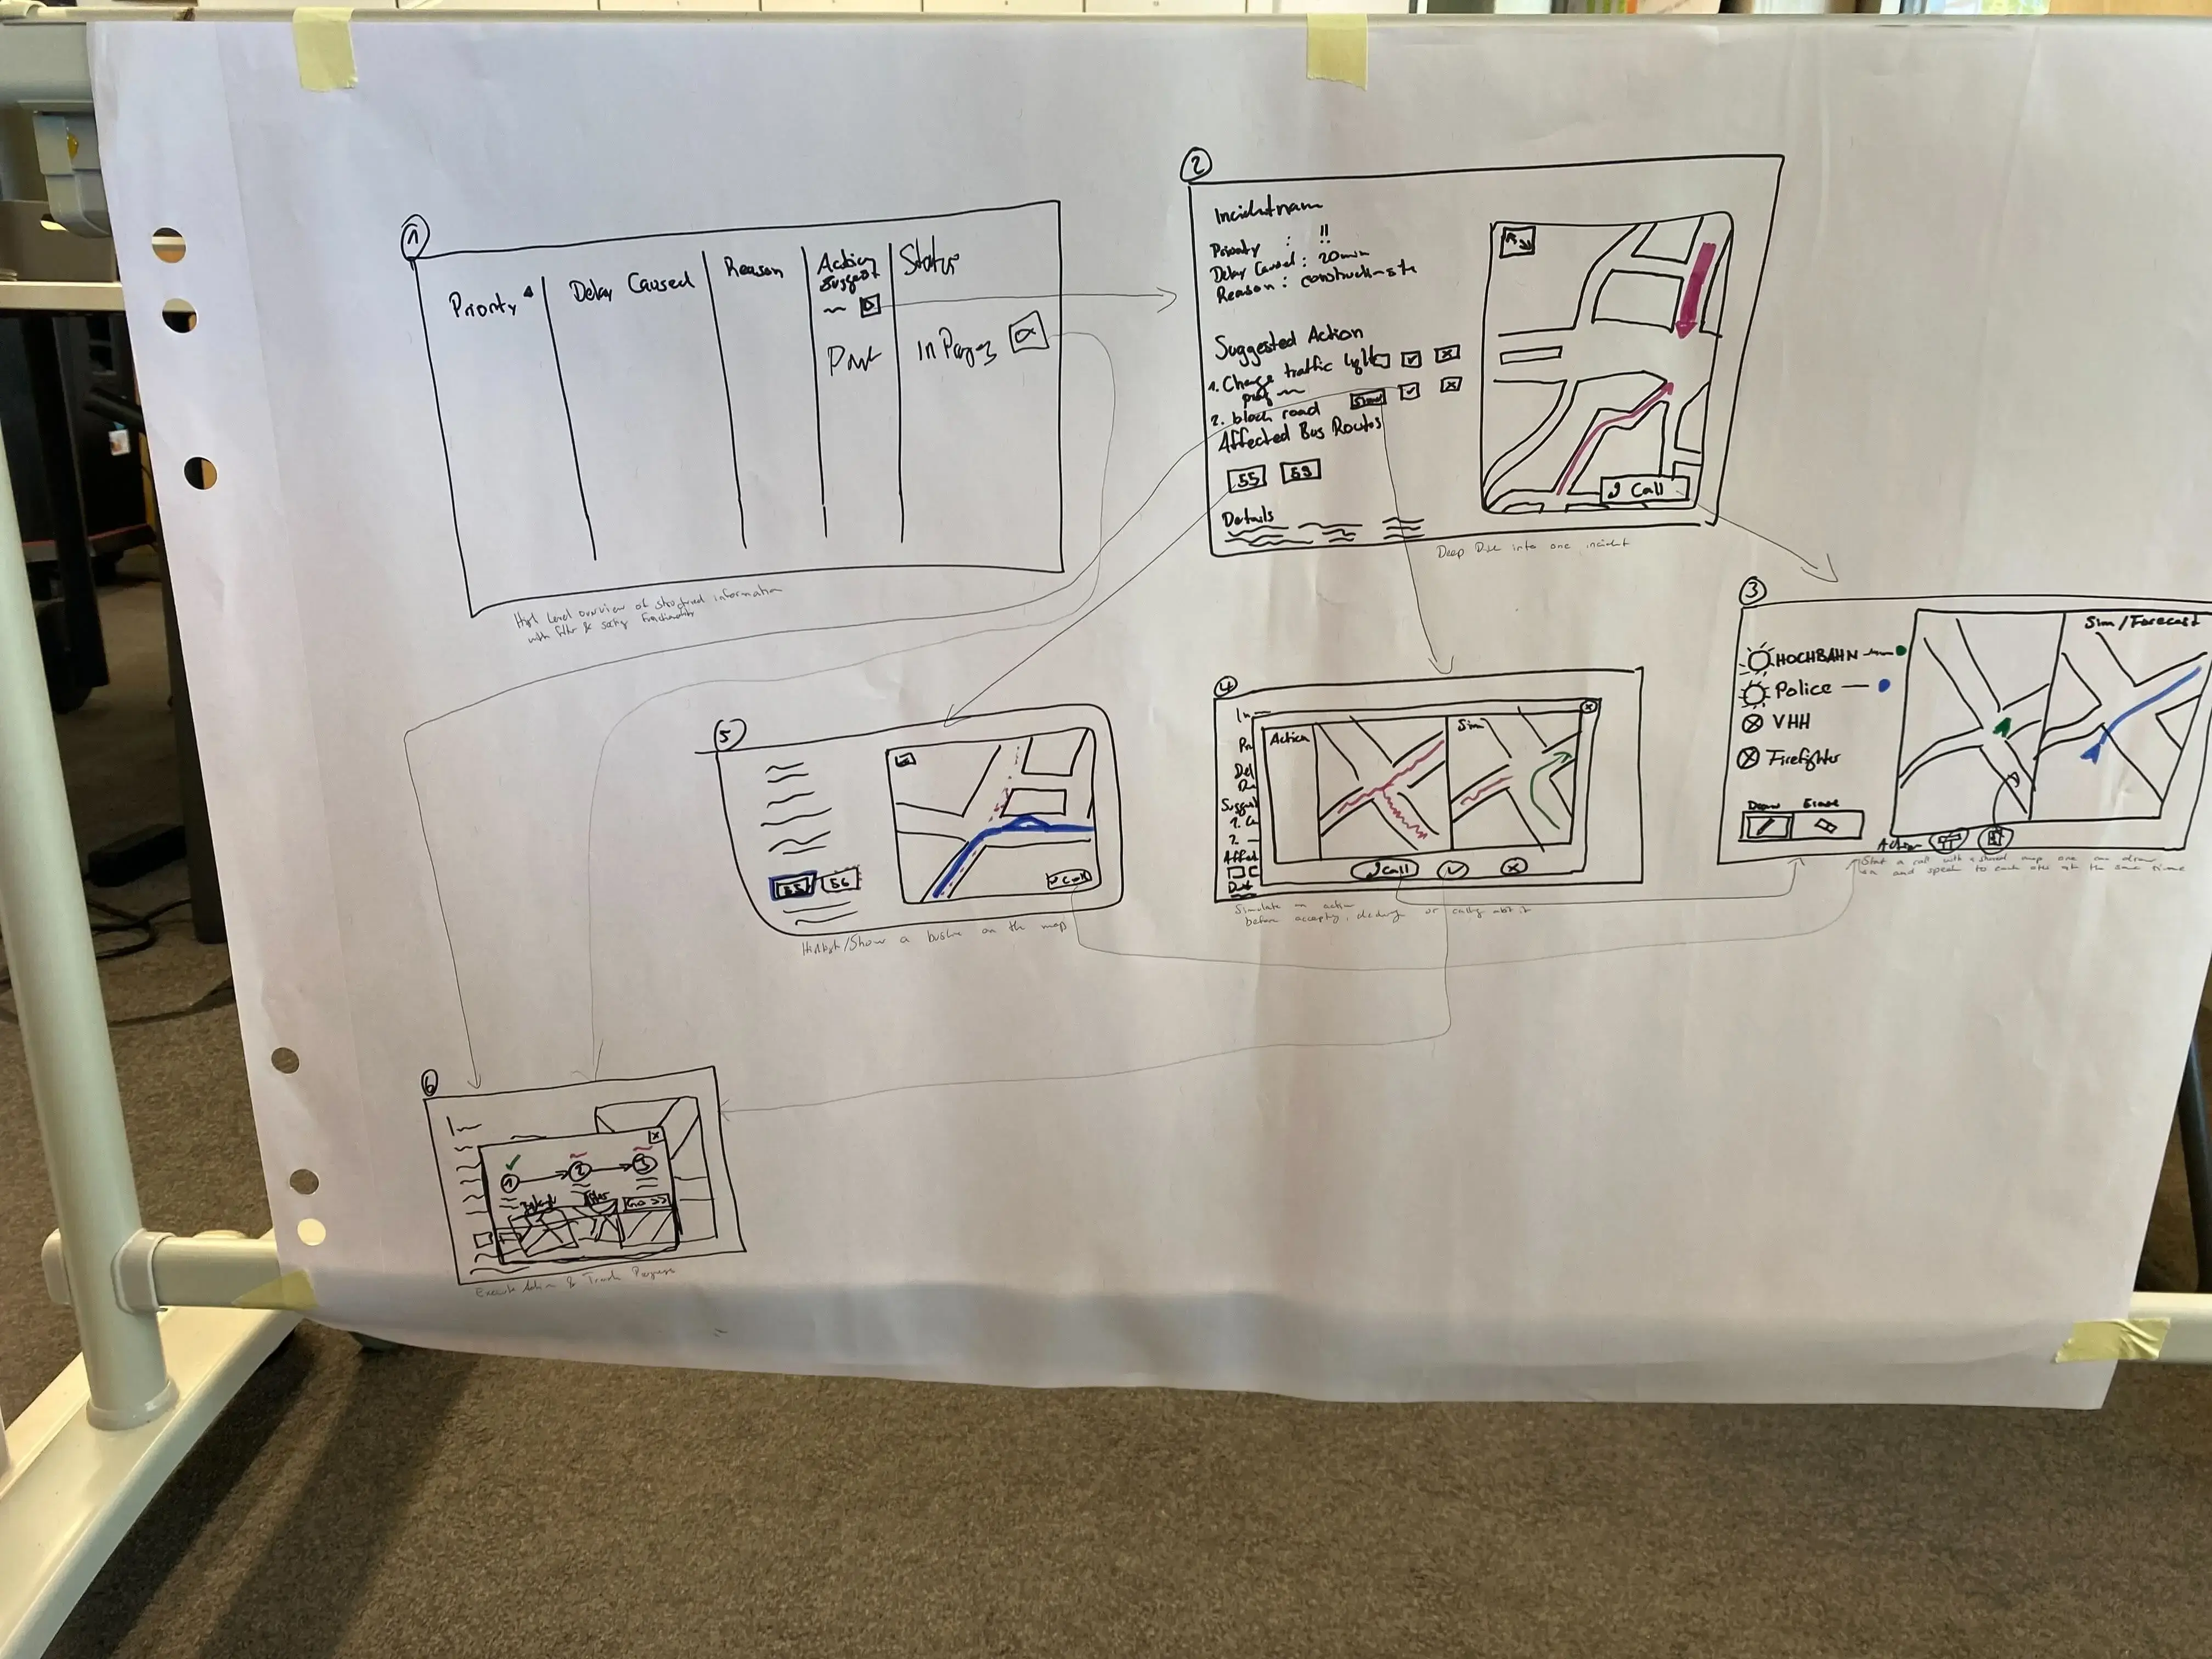
Began sketching initial ideas for a table of incidents and linking them to their locations on the map.
Focused on presenting detailed information for each incident and exploring ways to allow users to select recommendations.
Worked on integrating recommendations and finding ways to visually display them on the map when selected.
Exploration and Iteration
In the testing stage, we focused on realizing the usability of the product features and user flows, and users' preferences of visual styles. We got some positive feedbacks for the product concept. Yet, we also found some issues in the design. For that reason, we made some iterations based on our observation.
Exploration 1
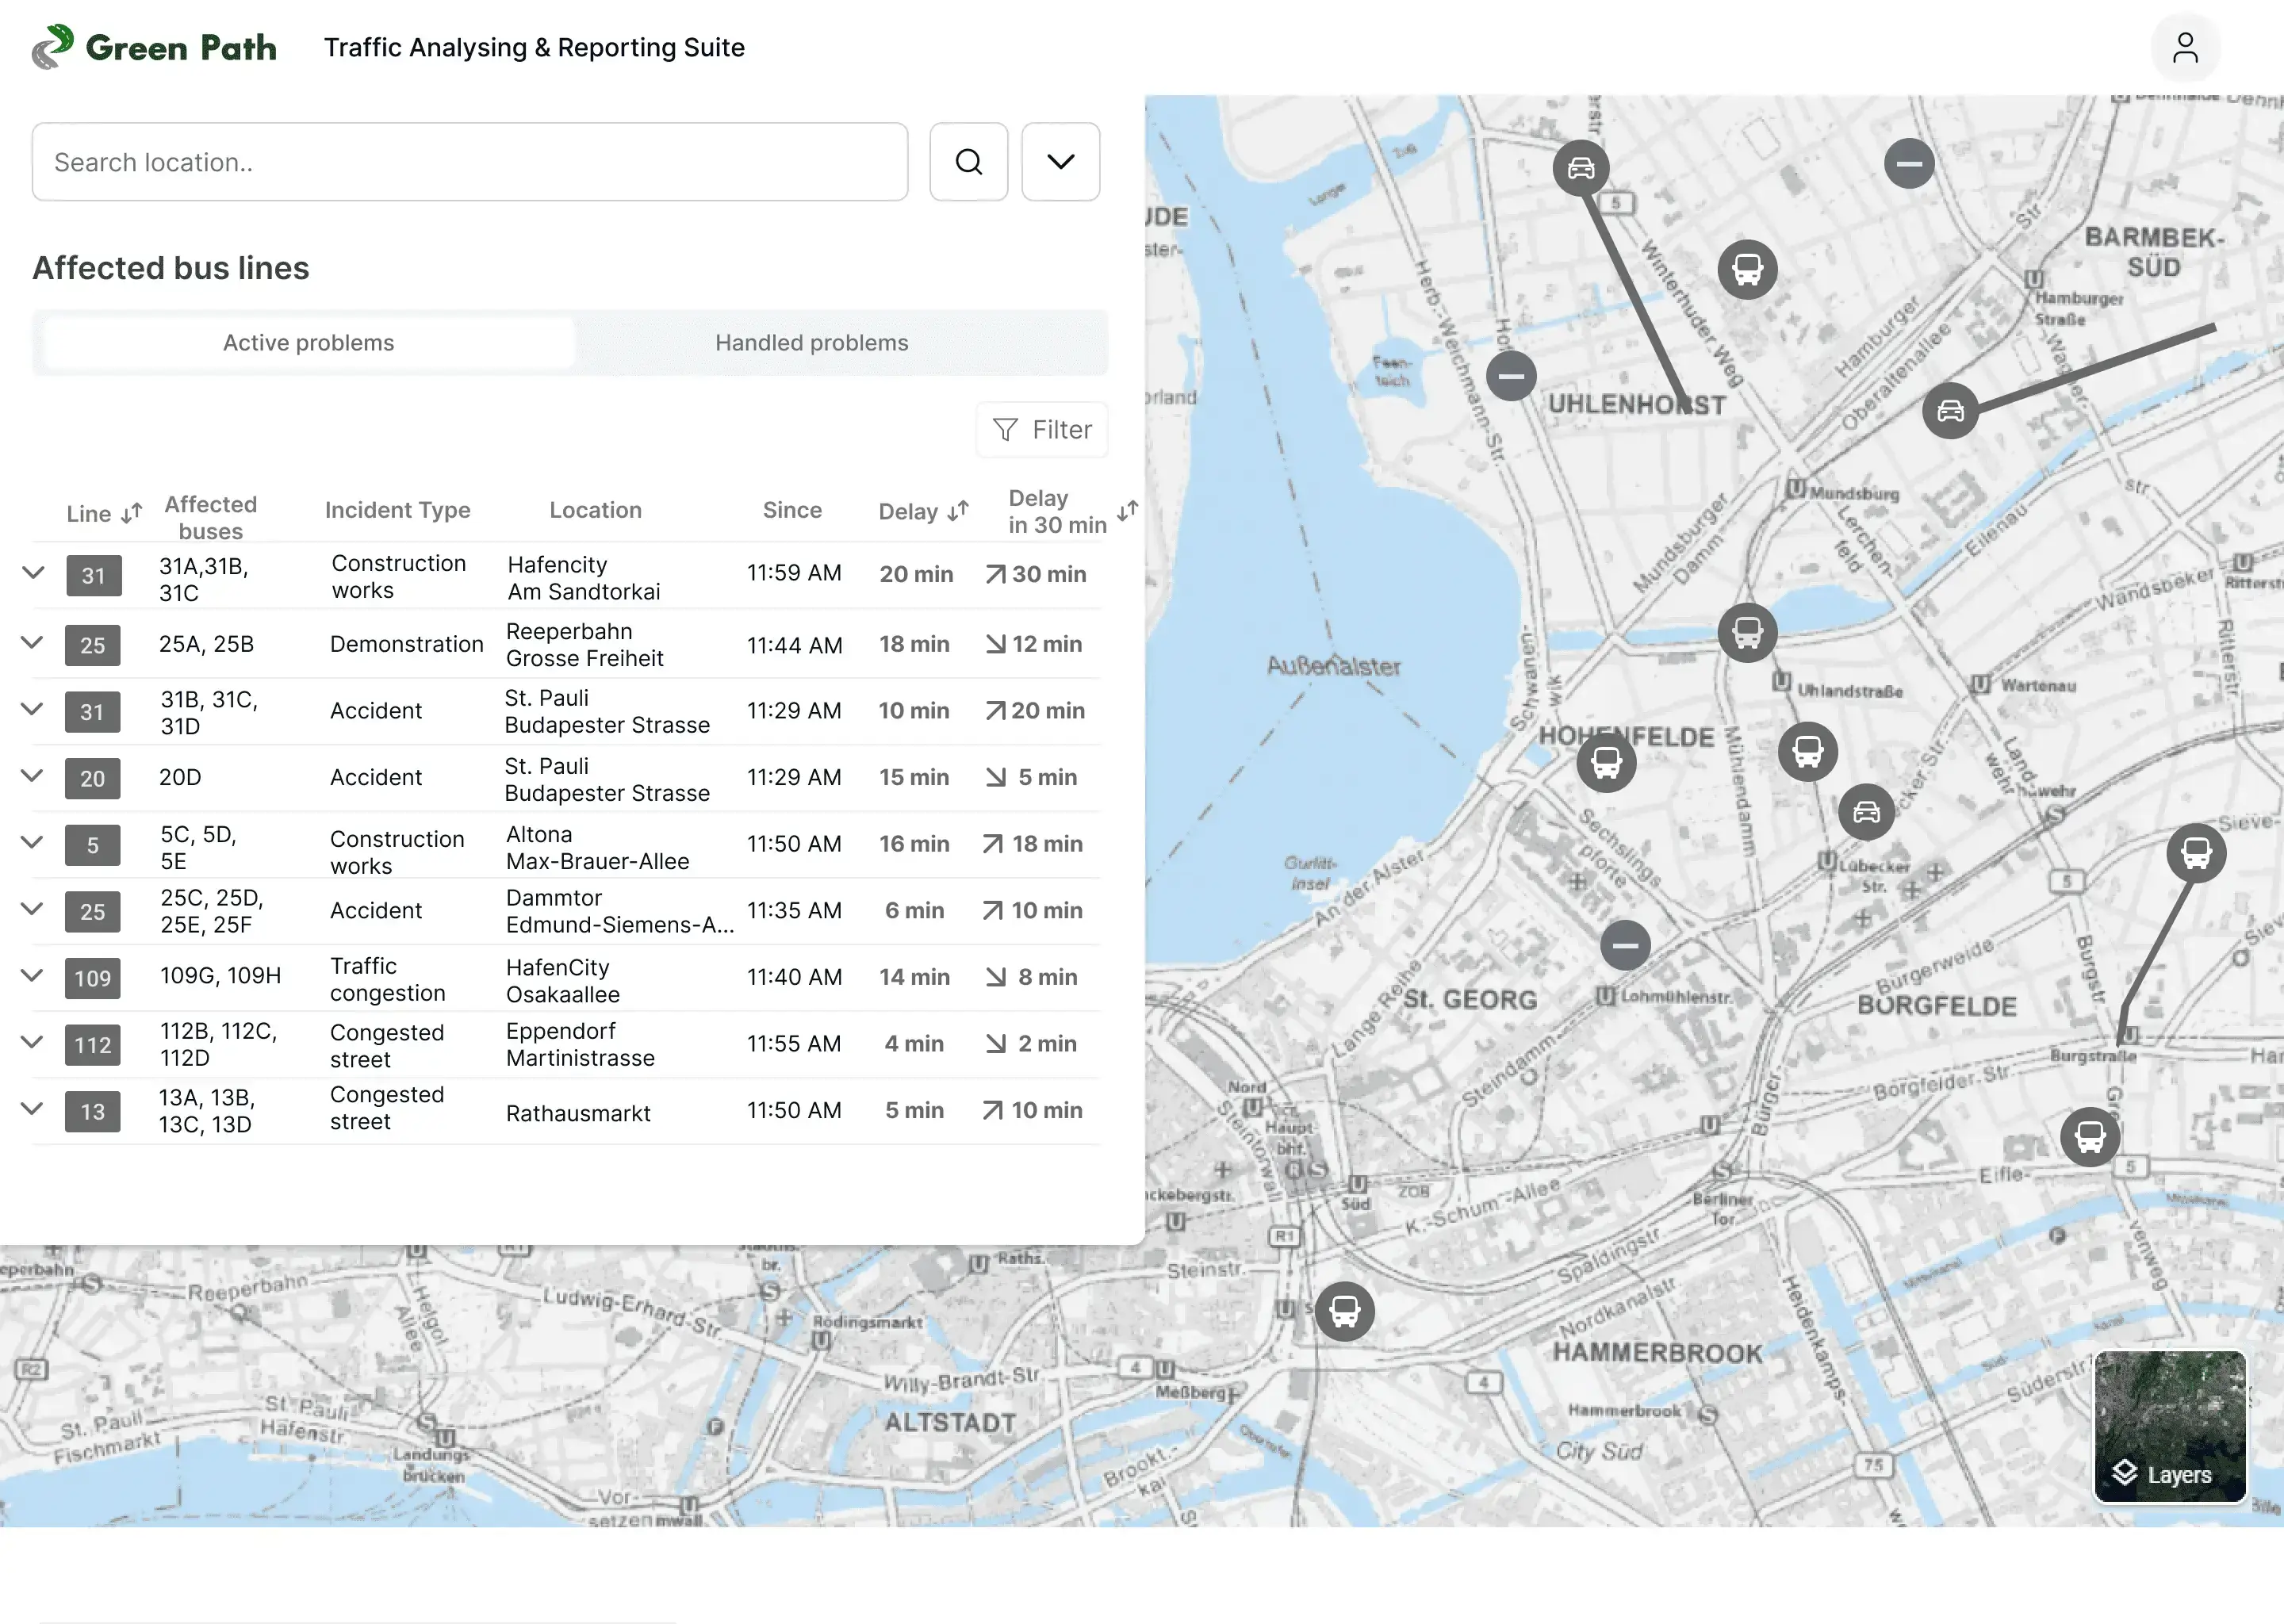
Incident and bus line overview table
During testing, we examined the table interface's usability, information clarity, and map
integration, focusing on filtering by bus lines or incident types and linking incidents to
map locations.
- The bus lines should be displayed in different colors, as VHH and Hochbahn use distinct colors for their lines.
- A 30-minute delay is difficult for them to interpret and understand.
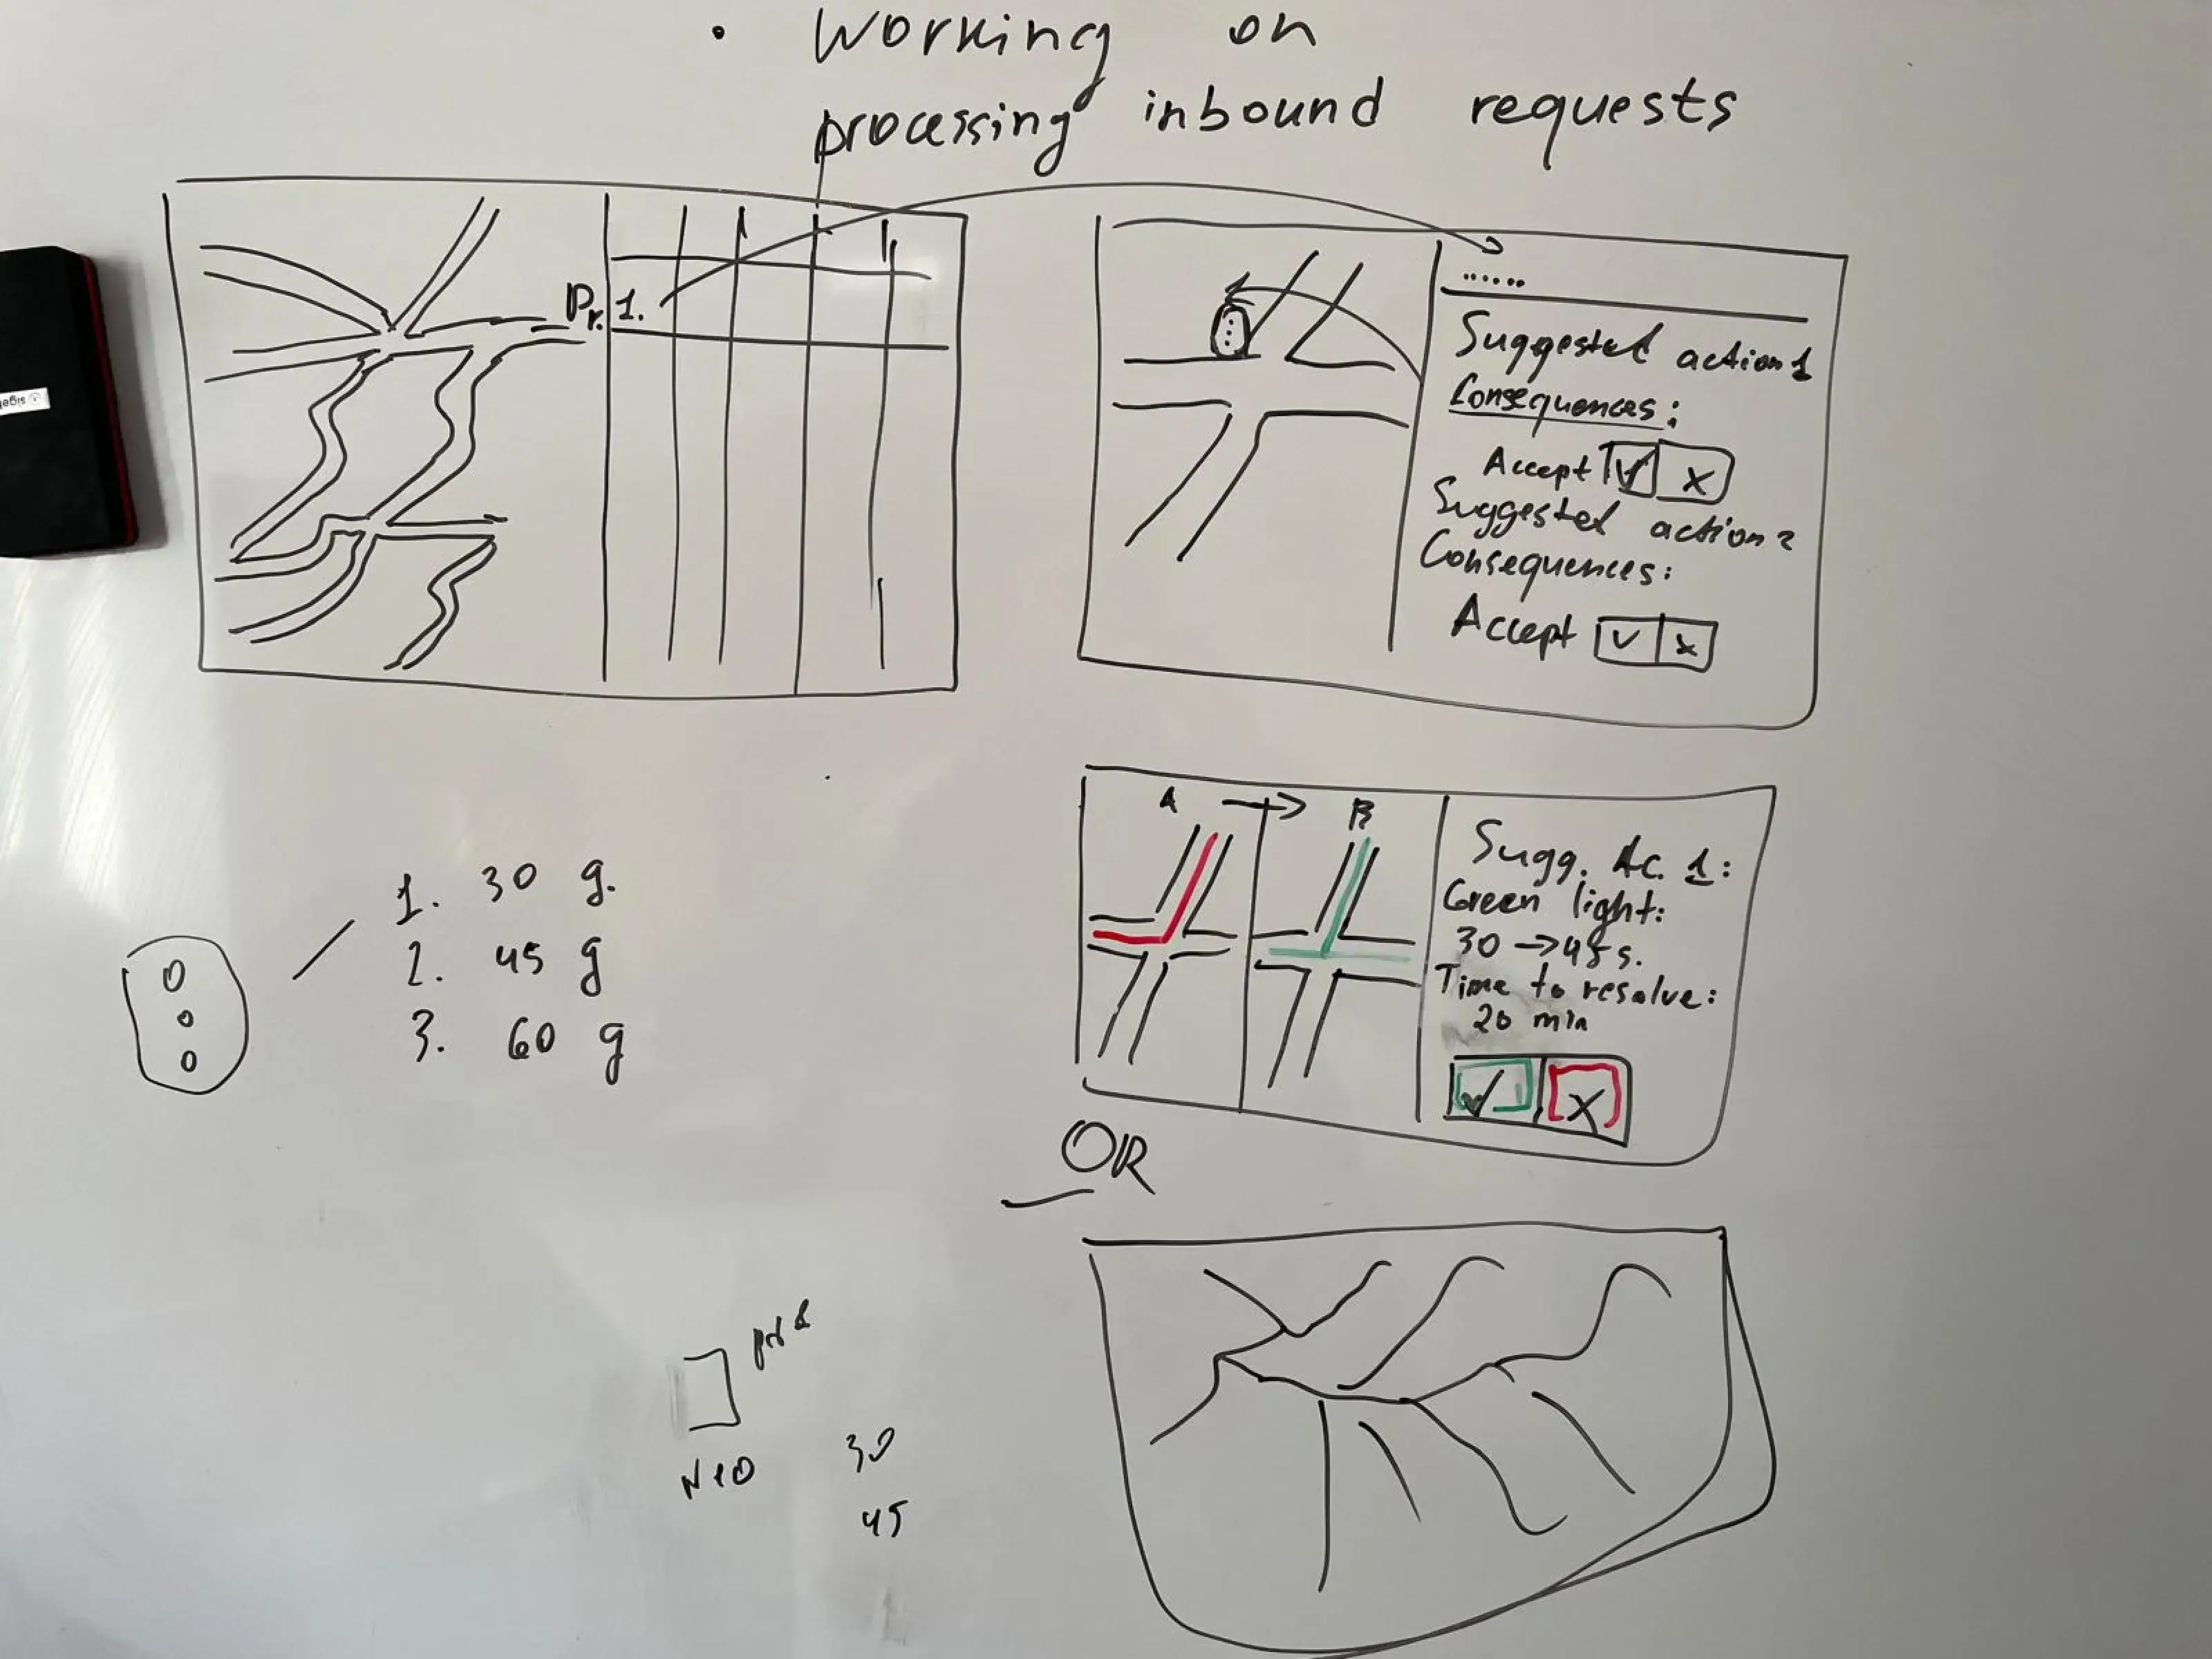
Exploration 2
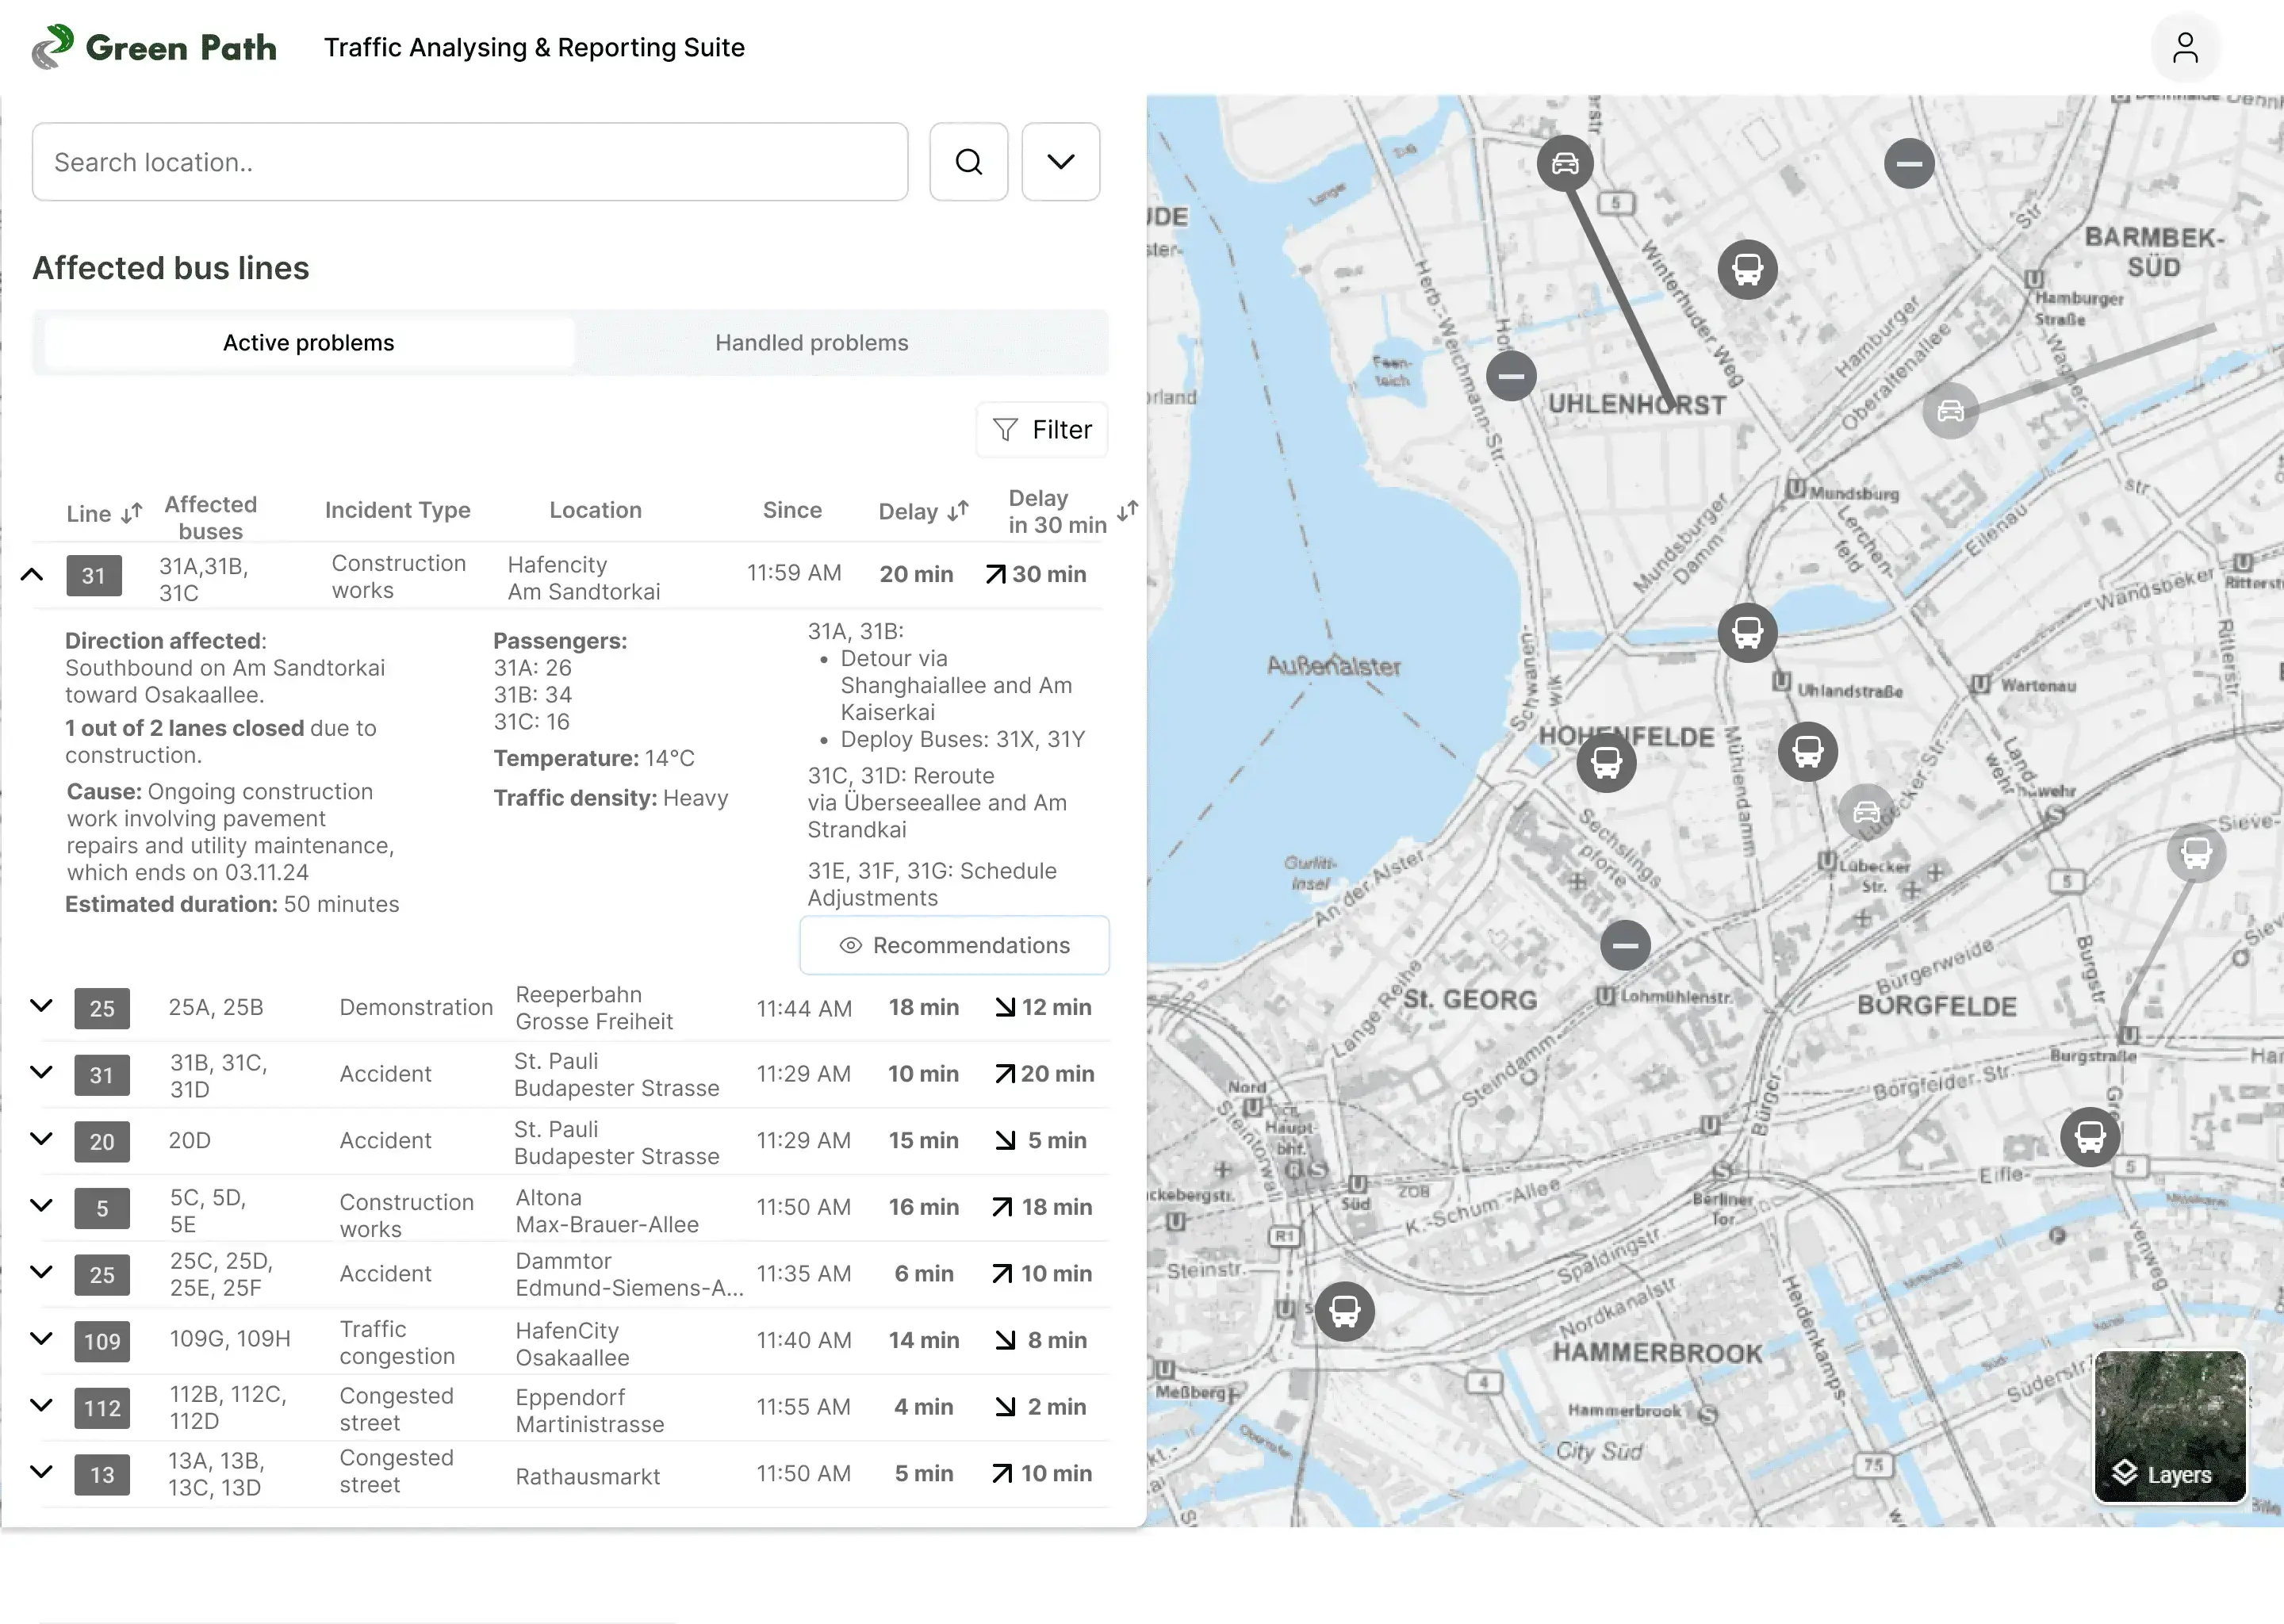
Detail about incident and recommendations
In this exploration, we included passenger numbers to indicate how many people are affected
by the incident and added recommendations to enable quick decision-making without the need
for calls.
- Users prefer not to navigate to a different page for recommendations but liked the recommendation feature.
- The information provided is overwhelming. Passenger numbers on buses are not necessary.
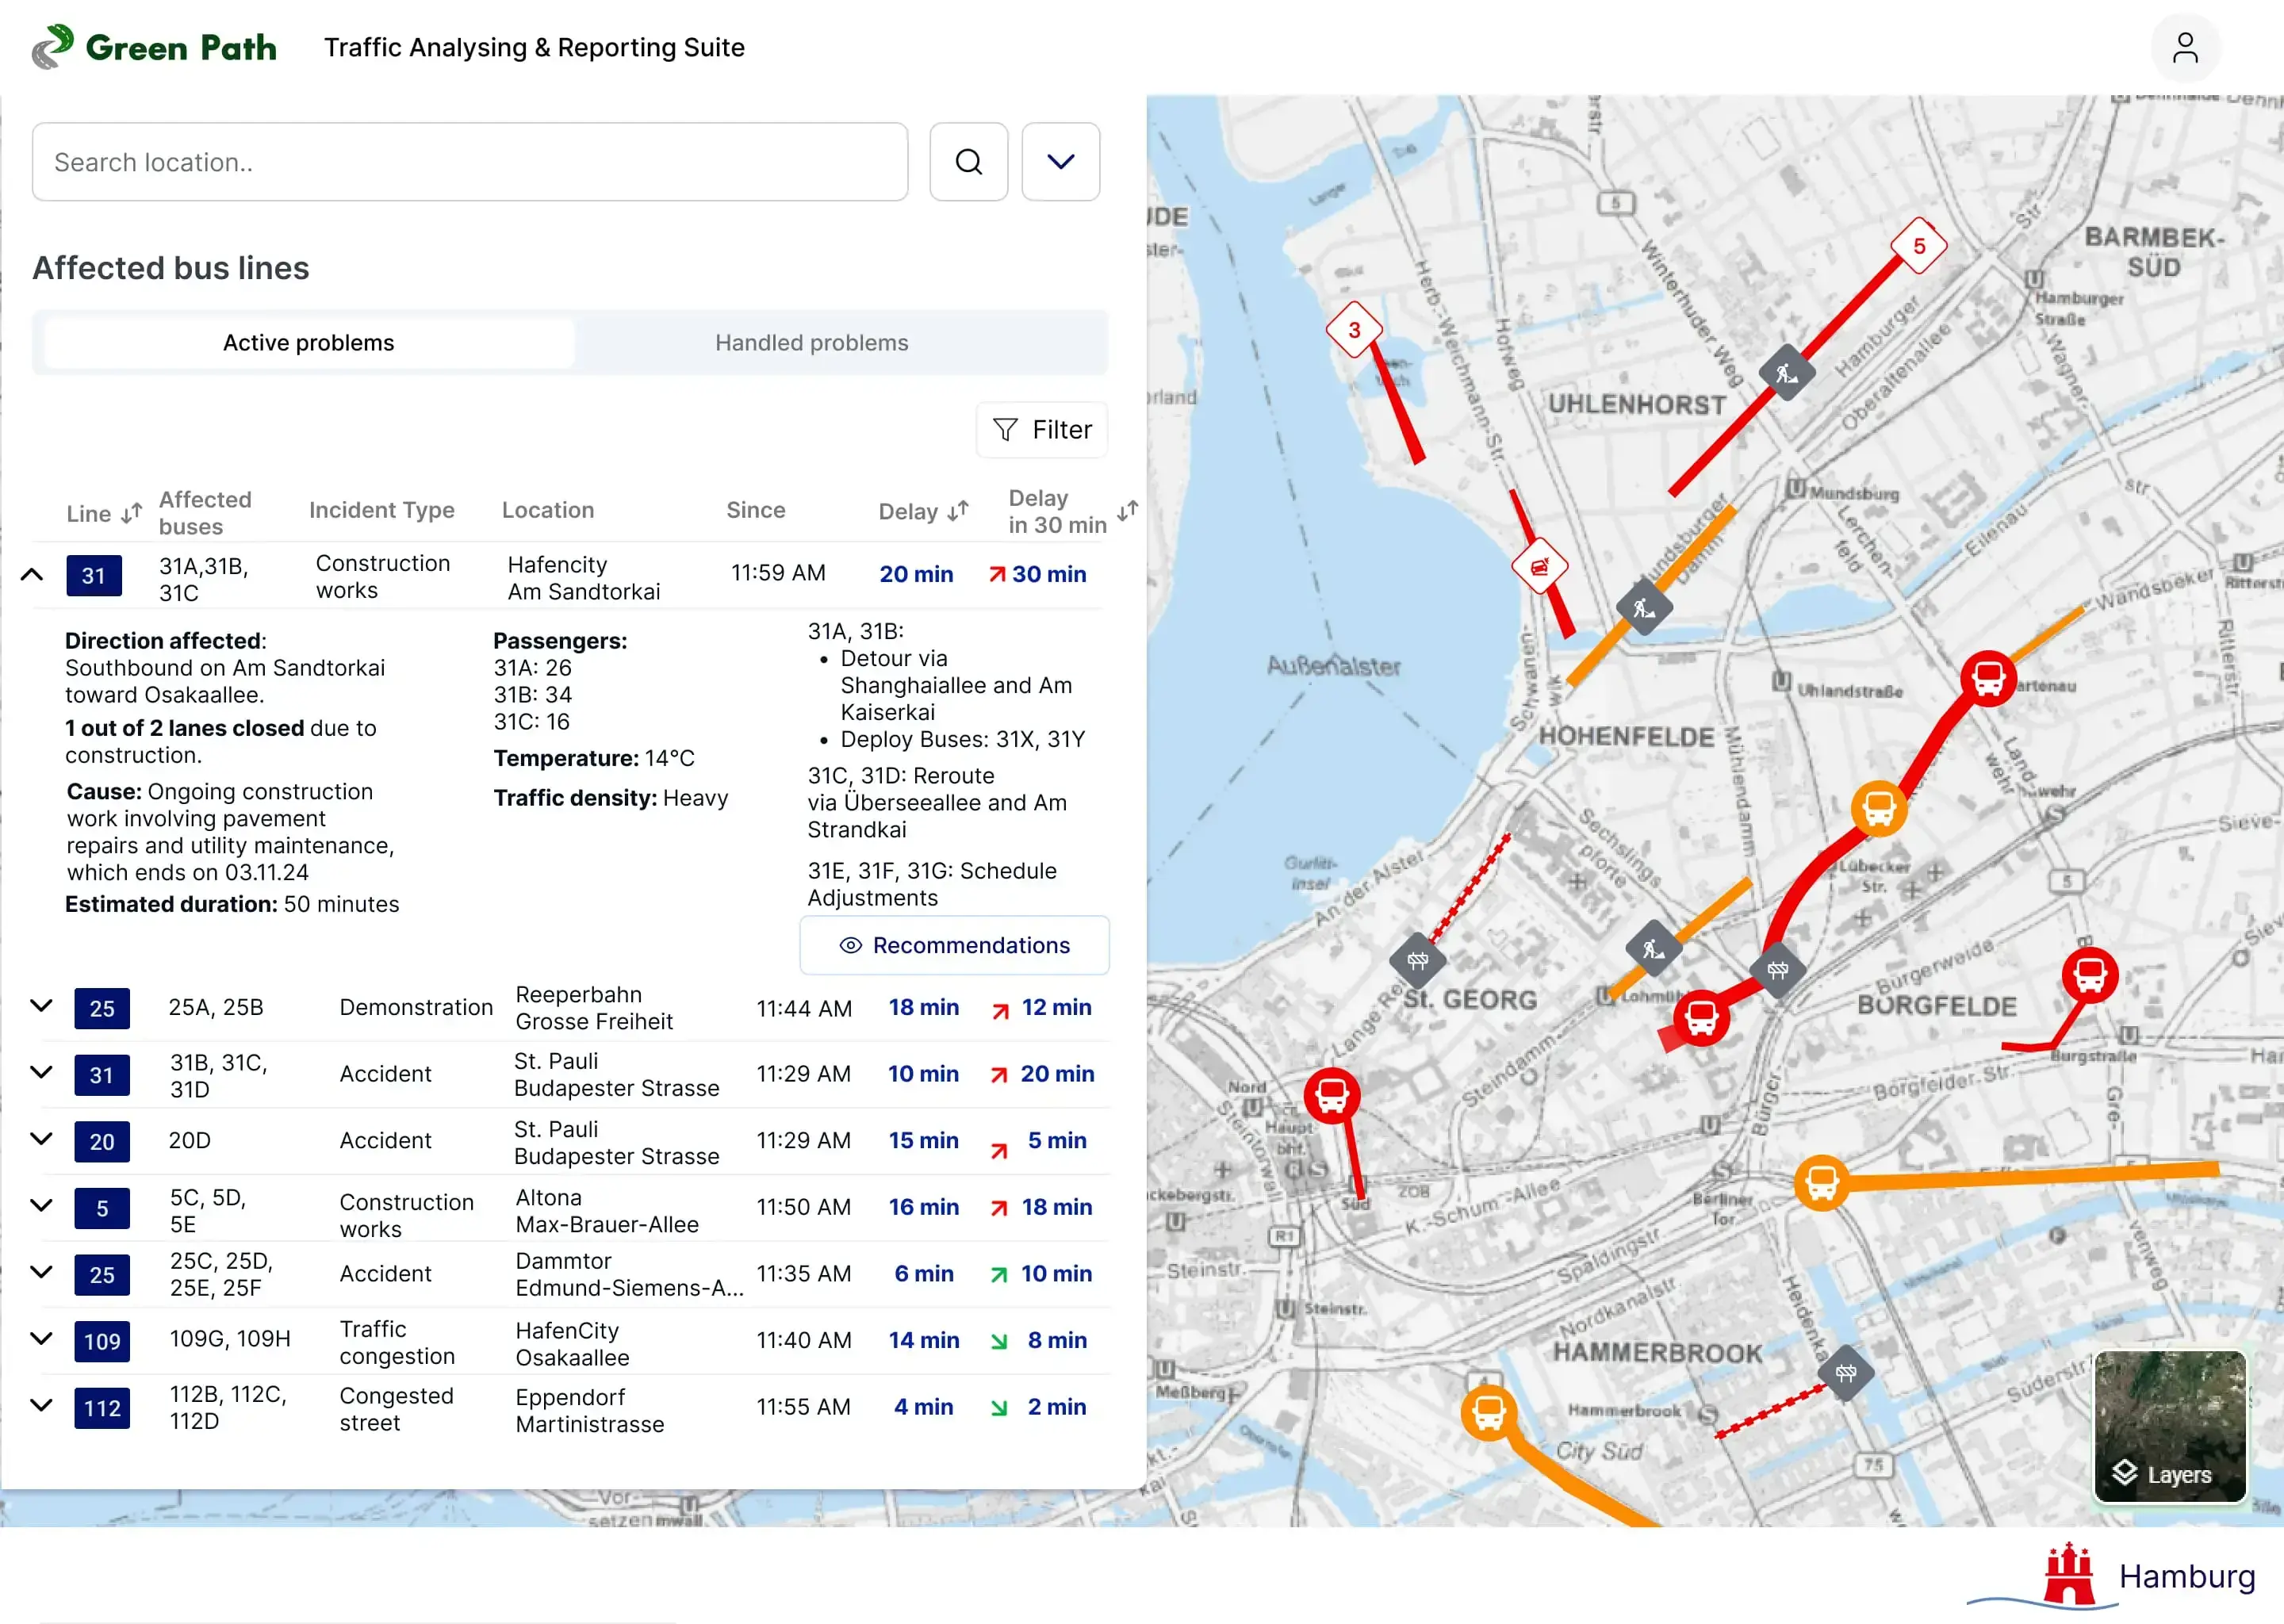
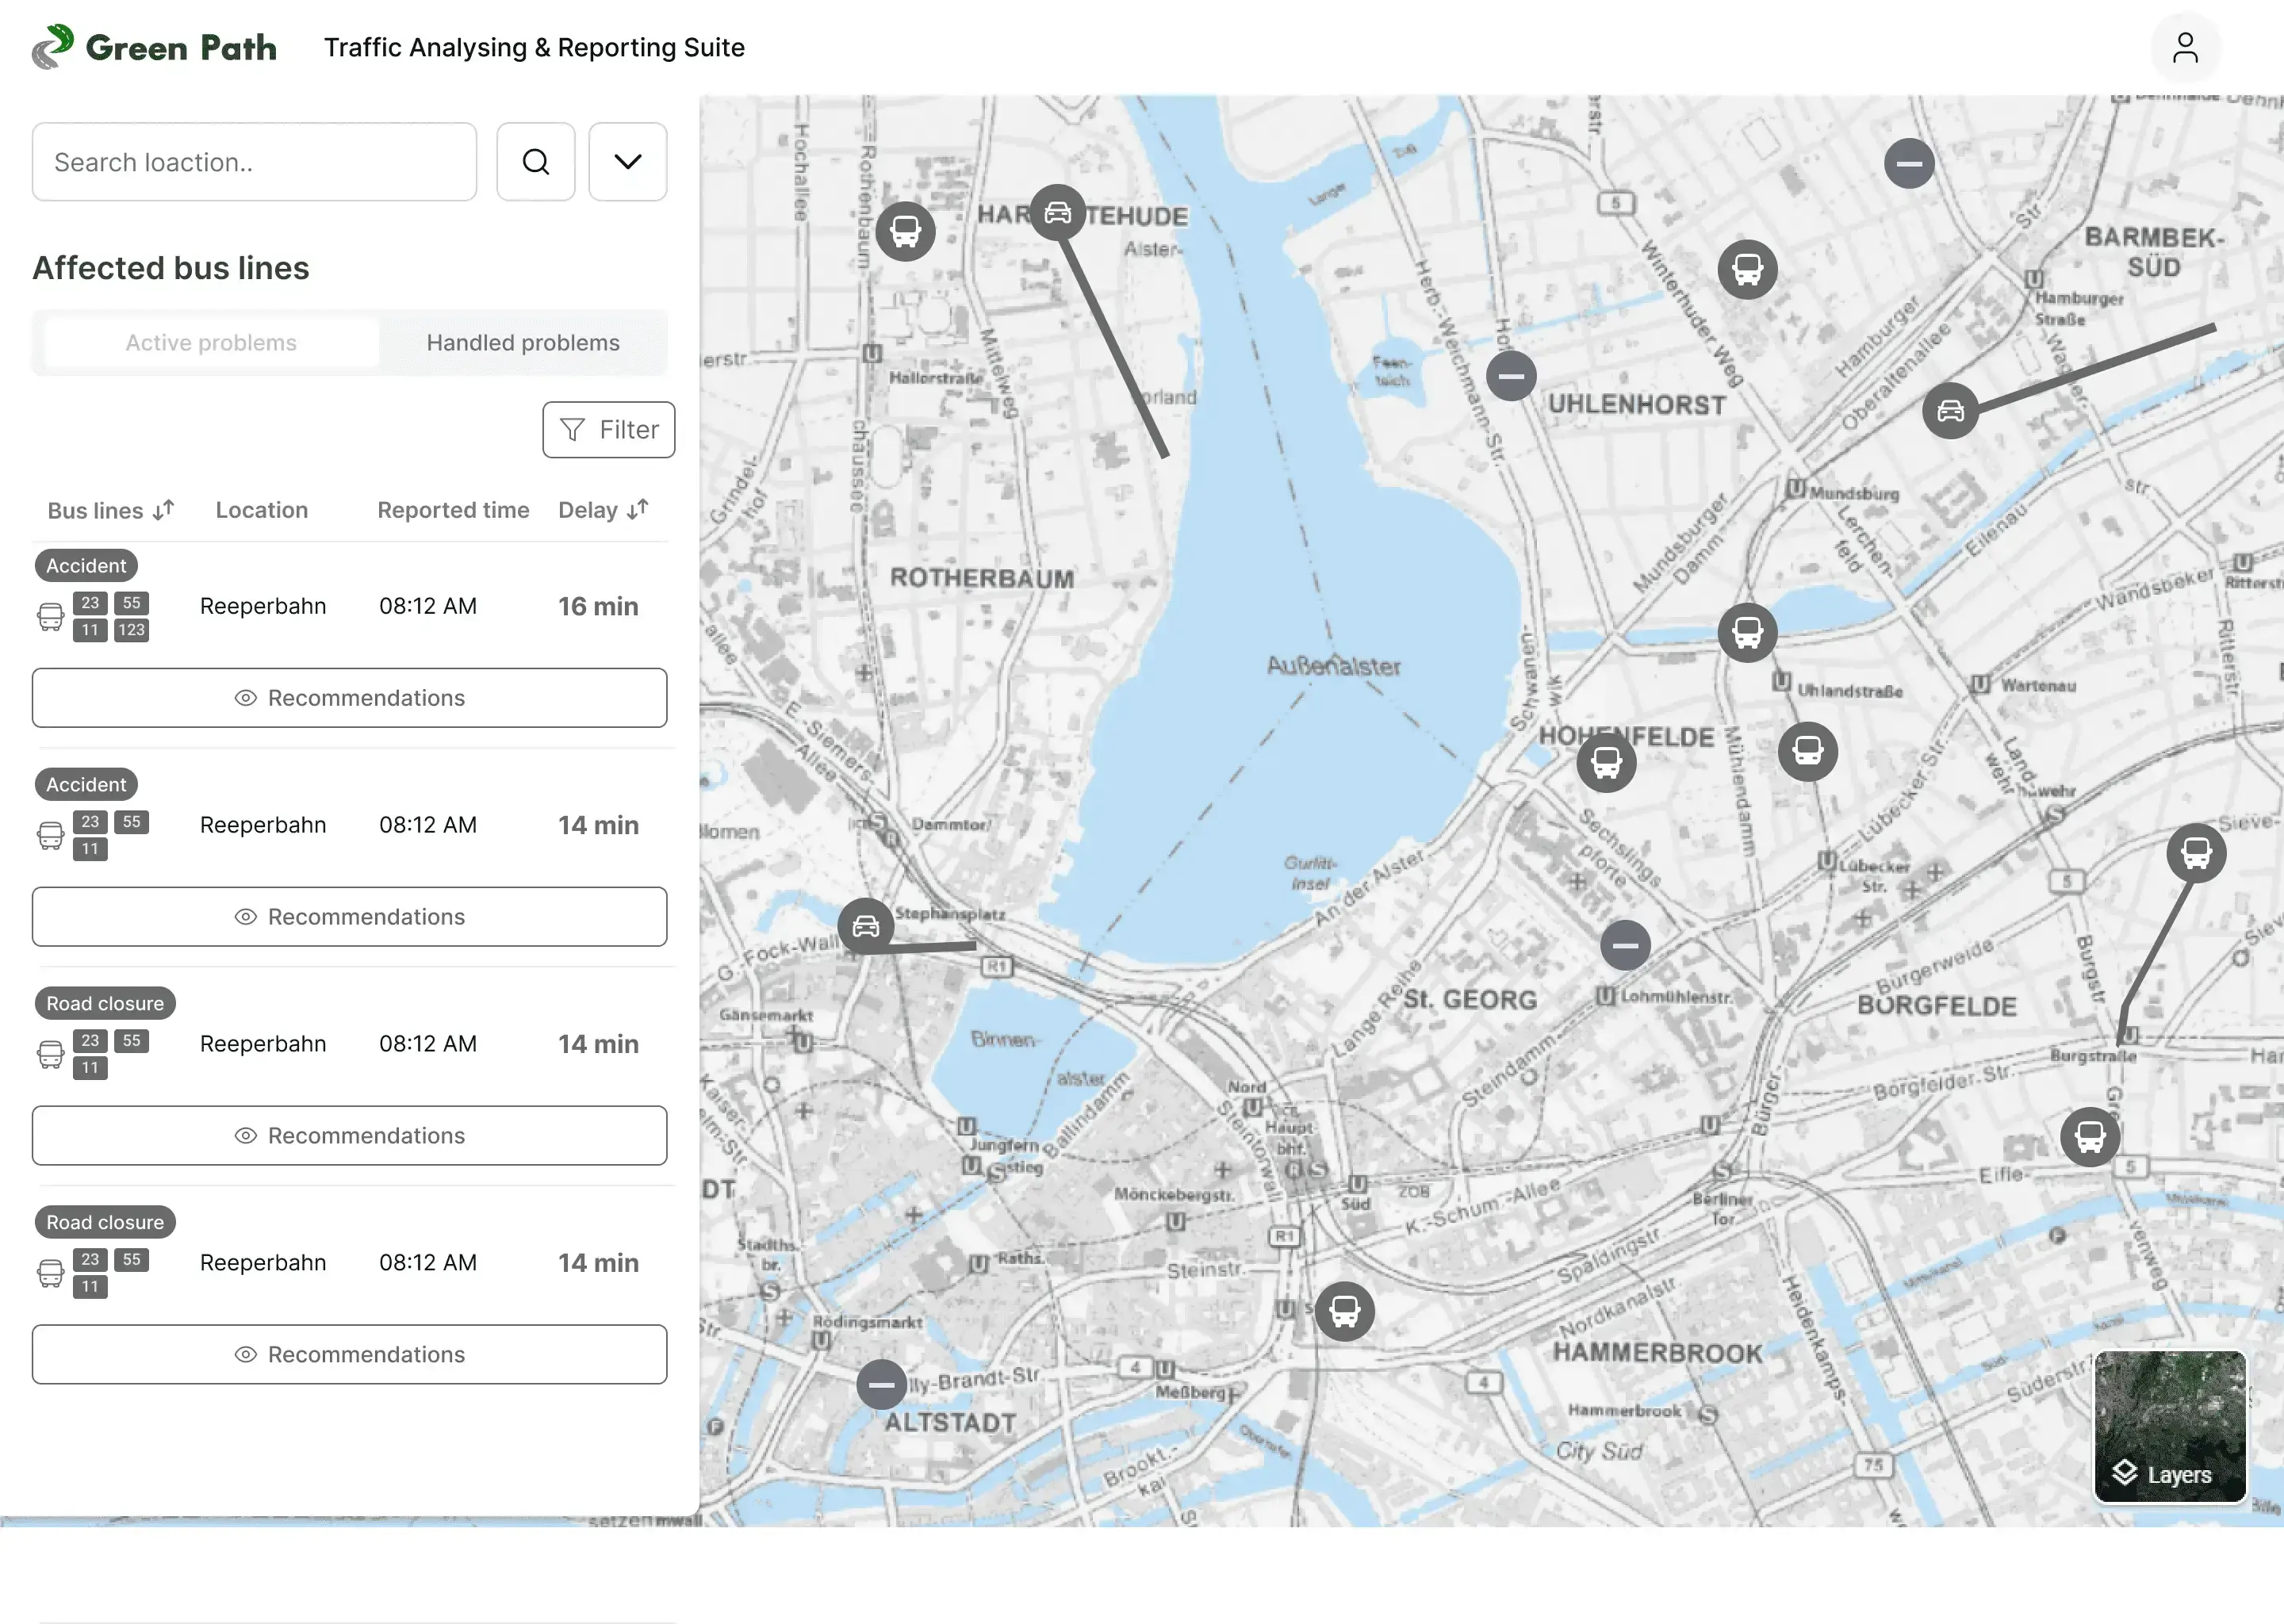
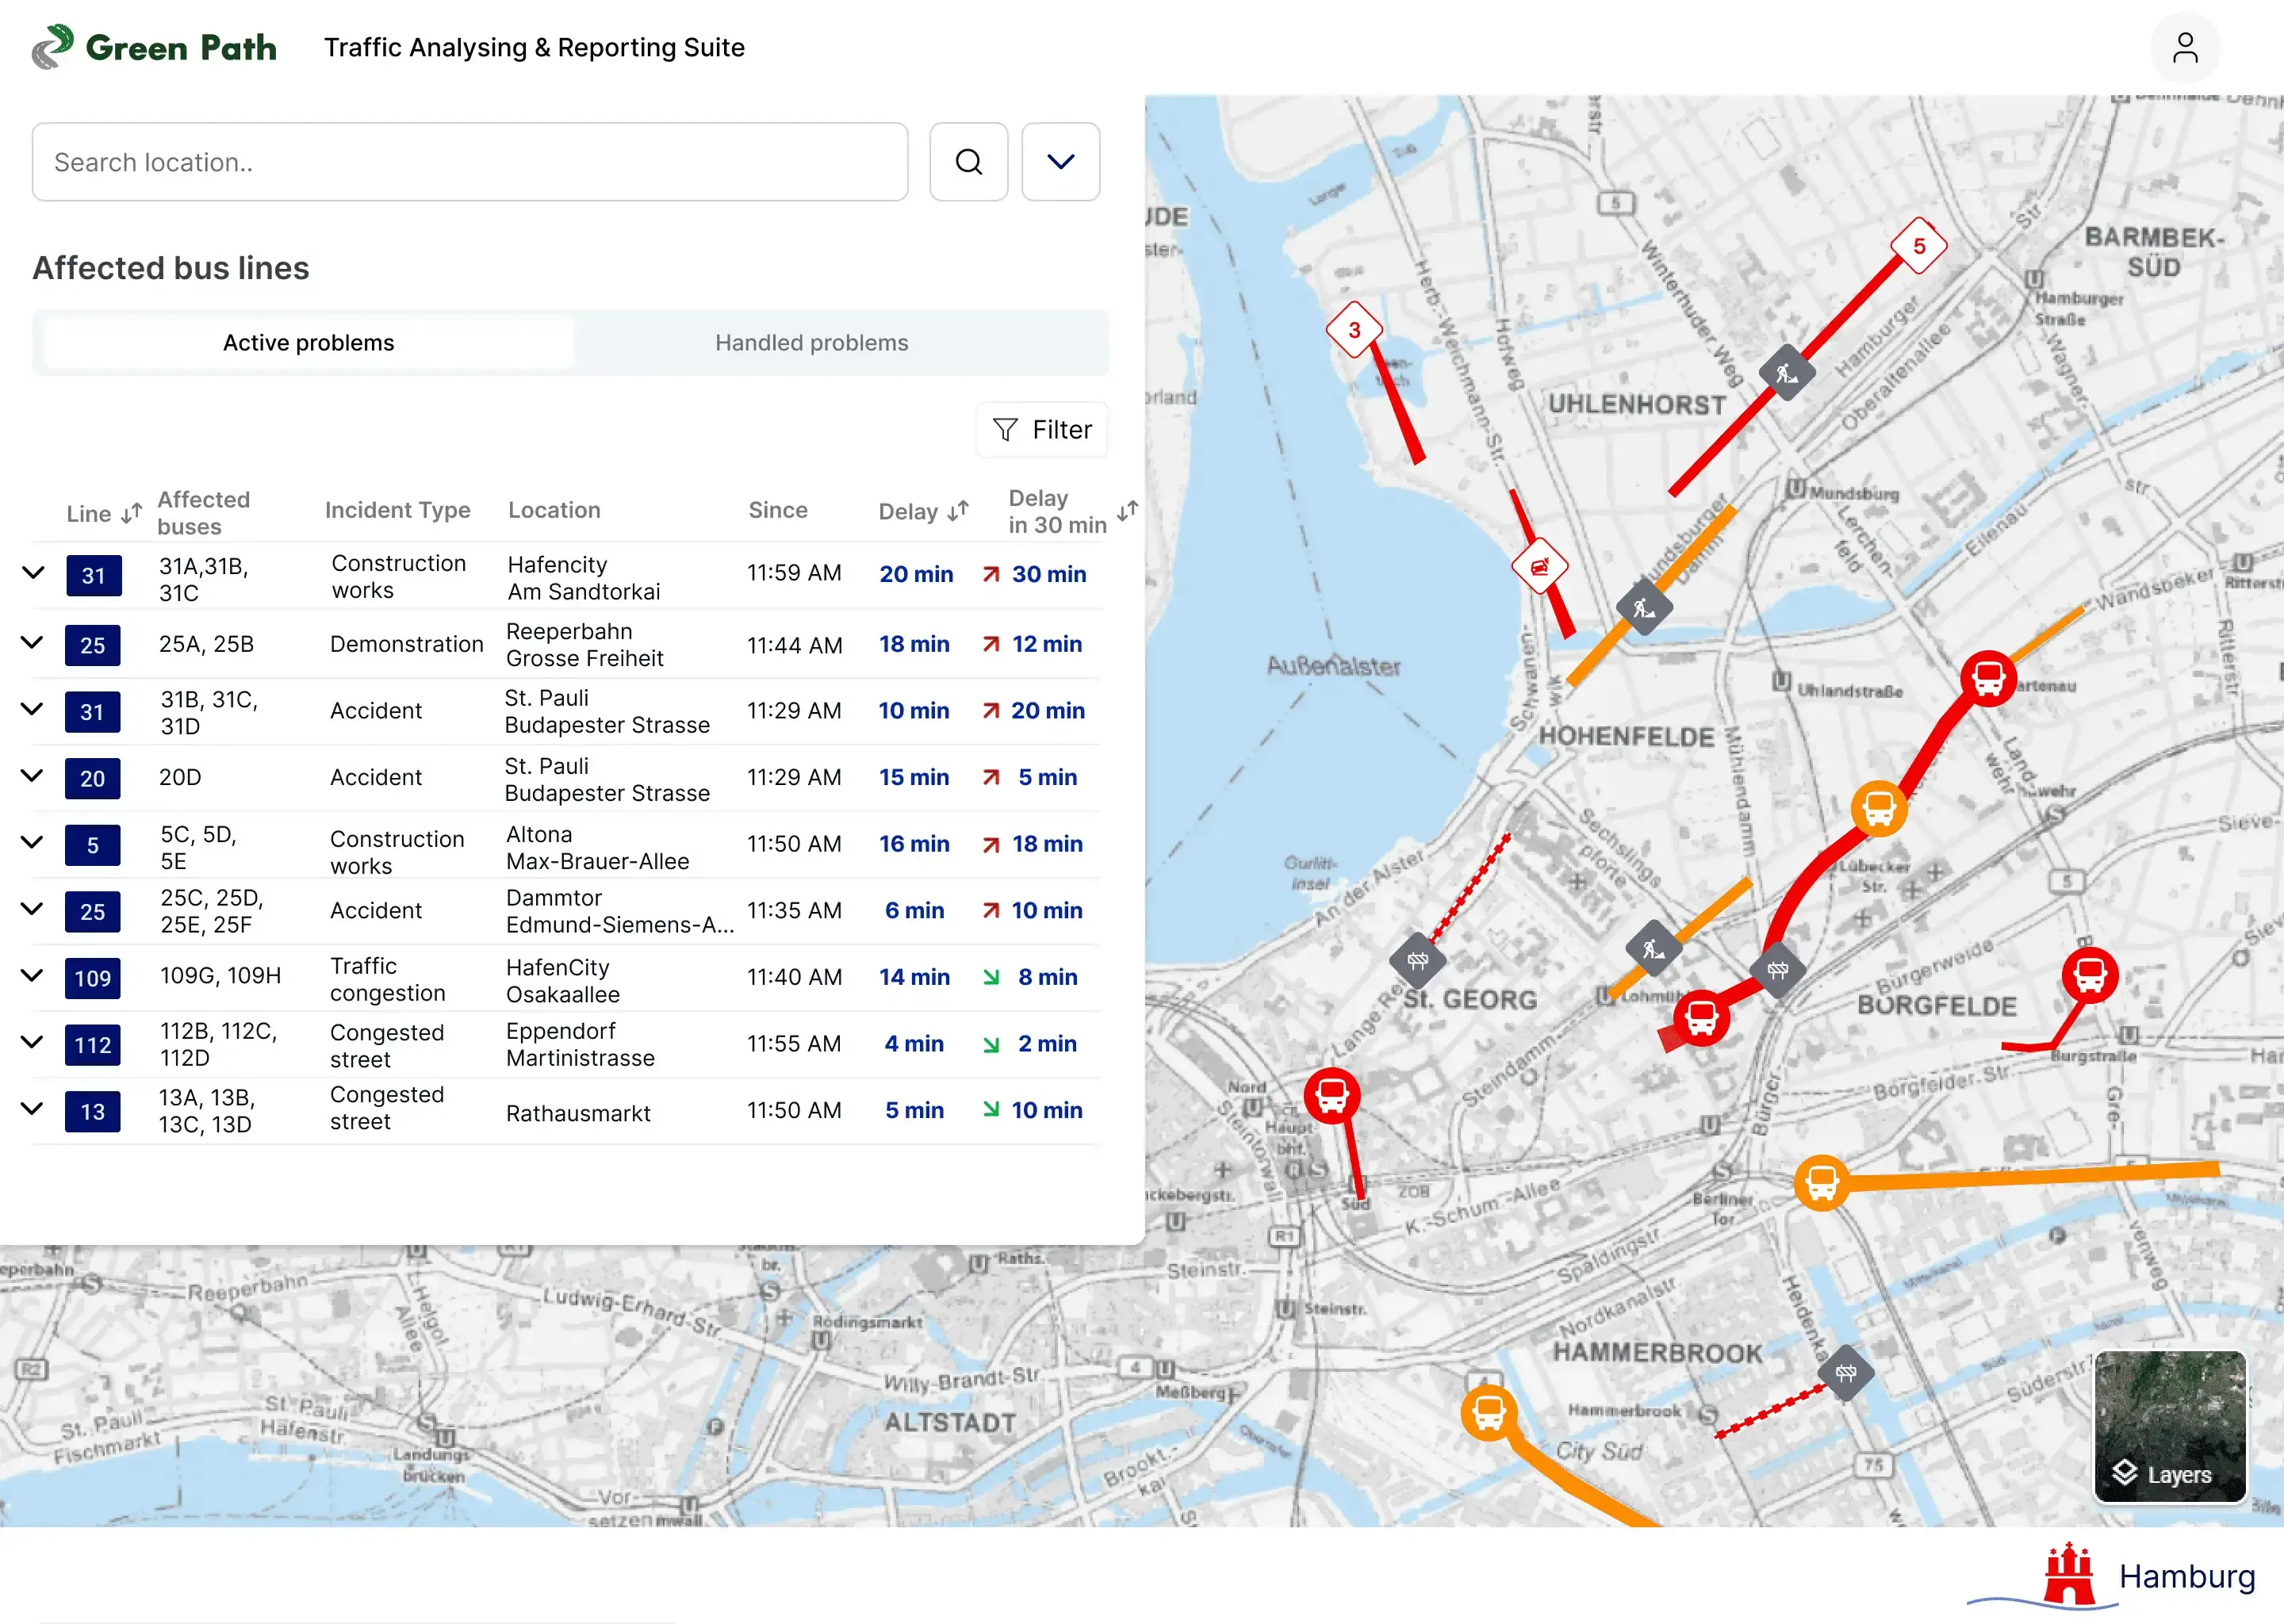
Final Product
In the final result, we implemented all changes based on user feedback from testing. The project streamlines traffic control by integrating incident details, actionable recommendations, and real-time data, enabling operators to make faster, more informed decisions with ease.
Future Plan
When presenting the product to stakeholders, we outlined a clear roadmap to guide its future development and ensure it aligns with user needs and project goals.
Step 1
Refine the design
Incorporate all user feedback from testing to ensure the design addresses user needs and enhances usability.
Step 2
Implement core features
Develop and integrate all planned features based on the refined design, focusing on seamless functionality and user experience.
Step 3
Expand recommendations
Introduce additional recommendation sections tailored to users' needs, enabling quicker and more effective decision-making.
Step 4
Optimize the map view
Enhance the map interface to improve clarity, ensuring users can easily view and interact with all essential information.
Key Takeaways
01. Being agile and adapt feedback![]()
In the beginning, I was worried about not doing enough research before designing. But
through the agile working methods, I embrace the incomplete product and learn to improve it
through product testing in the early stage of the design process.
02. Being proactive in a cross-functional team![]()
In a cross-functional team, it is important to be able to quickly get diverse input and
align directions from different perspectives. I learned how to provide insights when needed
as well as ask for clarification during technical discussions.
03. Seek help and learn faster
![]()
Collaboration played a key role in my growth as a designer. By seeking guidance from a
fellow designer, I gained valuable insights and learned new techniques more efficiently and
effectively.
04. Working collaboratively and
transparently![]()
Daily meetings fostered collaboration and transparency, keeping the team aligned and
engaged. This approach ensured effective teamwork and goal achievement.